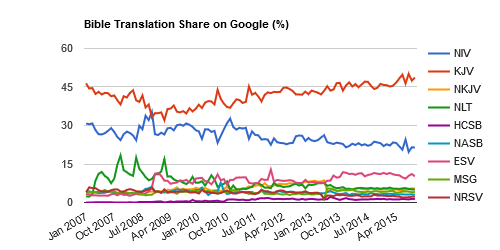
New from the OpenBible Labs: a chart that tracks the popularity of English Bible translations (click for a larger version):
The goal is to see how well this kind of data tracks official marketshare figures. Unfortunately, I’m not aware of any publicly available marketshare figures. (If anyone knows of any, feel free to leave a link in the comments.) In principle, this chart should provide a leading indicator of sales—if you accept the idea that mindshare precedes sales.
The result more-or-less tracks the CBA Bible Bestseller List (pdf), with a couple of exceptions. The chart appears to undercount the NKJV and the HCSB, which means that either (1) there’s a data problem—for example, some NKJV results may appear as part of the KJV data; or (2) these translations’ sales in CBA bookstores overstate their prominence as translations—in other words, they sell well in CBA bookstores, but people tend not to search for them much in Google. I lean toward the first answer: it’s likely that my methodology is flawed somehow.
Technical Background
The chart blends data from Google Trends and the Google Keyword Tool to see how many searches people conduct for various English Bible translations. Data before July 2008 is from Google Trends exclusively, while more recent months include data using the methodology described in Bible Translation Mindshare.
Originally, I wanted to use only this latter methodology. However, the data is chaotic; the figures jump around quite a bit, and the Google Keyword Tool sometimes gives inconsistent results even for the same search in the same month. For this reason, I decided to smooth the data a bit with Google Trends, which provides more consistent data from month to month.
Finally, I should mention that I have lots of potential conflicts of interest in producing this data.
