Browse this grid interactively.
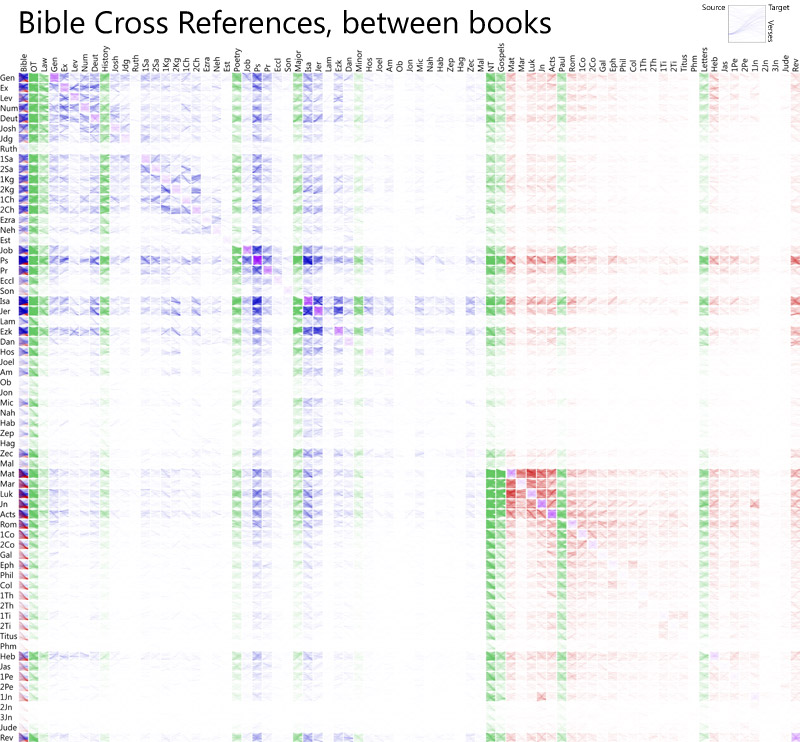
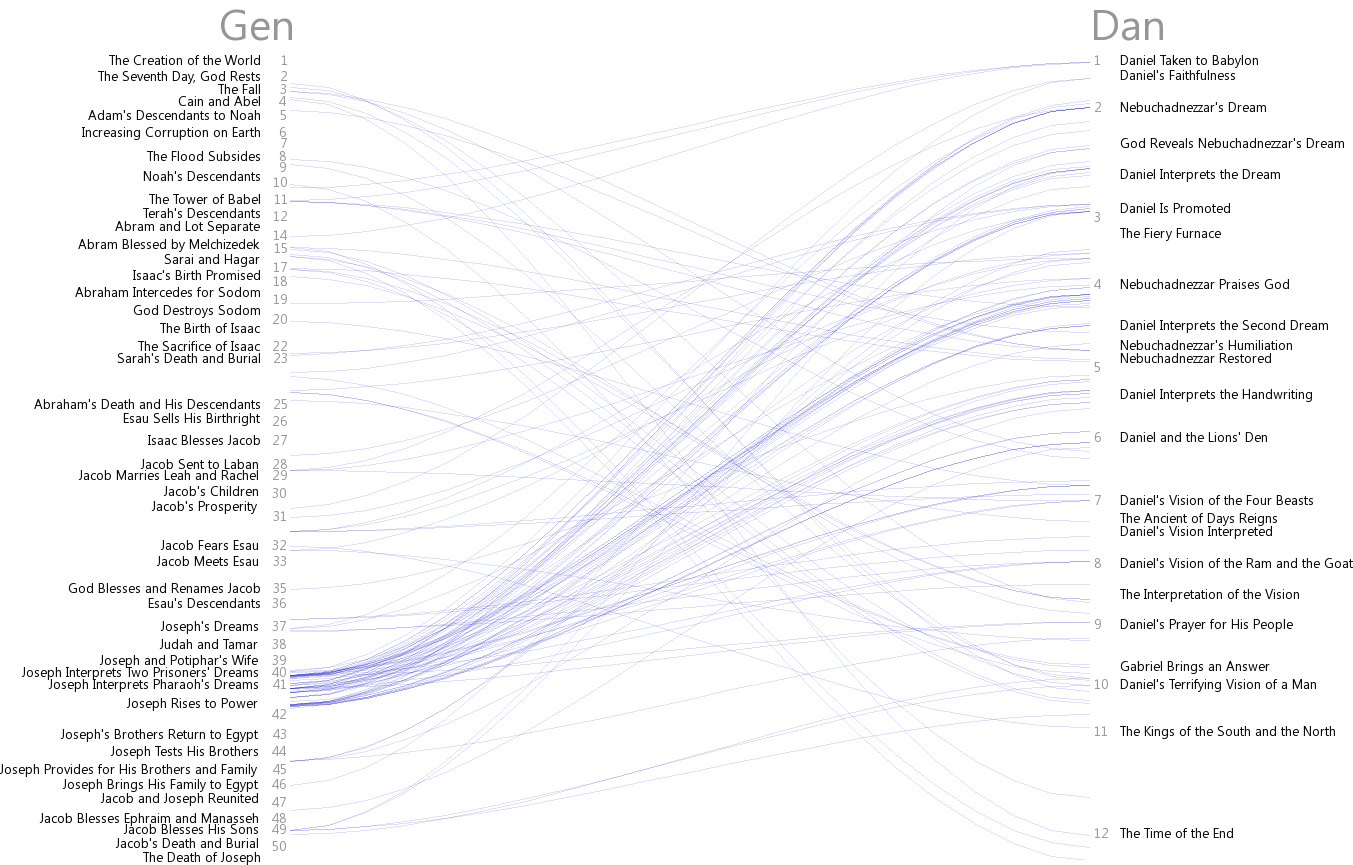
This visualization is arranged by book, showing cross-reference sources on the y-axis and targets on the x-axis. Within each square, the first verse in the book or section is at the top, and the last verse is at the bottom. Here’s what a detail of a square looks like:
Genesis 1 is at the top left; Genesis 50 is at the bottom left. Daniel 1 is at the top right; Daniel 12 is at the bottom right. The most-striking cross references between these two books, to me, involve Joseph’s interpretation of dreams in Genesis 40-41 and similar stories in Daniel.
Also see a previous cross reference visualization.

What do the colors (green, red, blue) represent? I’m guessing red is New Testament, blue is Old Testament, and green is a major division and perhaps purple is a reference within the same book? It appears that’s the pattern, but it’s not clear from the post.
You’re correct about the colors. If you click through, the visualization is explained in somewhat more detail at the bottom of the page.