Just in case you wonder how seasonal people’s interest in reading the Bible is, here’s a chart from Google Trends showing five “read through the Bible”-related search terms. The peaks every January speak for themselves. You can see a secondary peak in August or September when classes get underway at many schools.
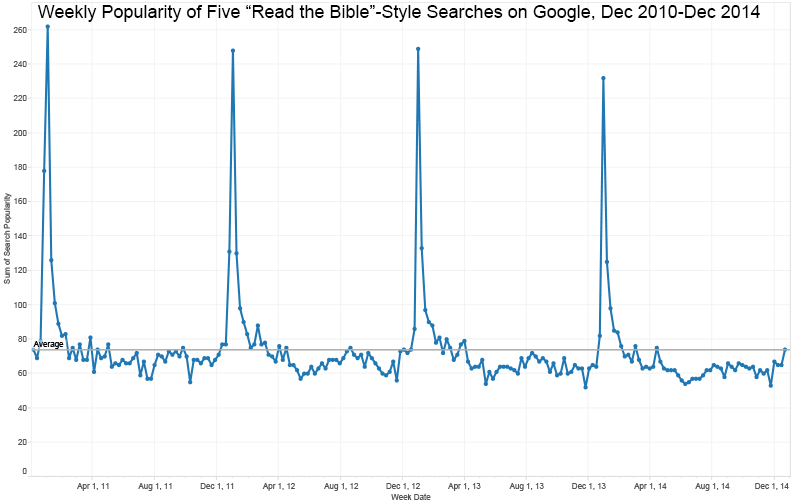
If we take some of the above data, plot it by week rather than by month, and add it together, the effect is even more vivid:

(This chart goes through December 27, 2014.)
You see huge peaks just before and after January 1 each year, along with a small bump around Easter and the aforementioned mellow spike in August or September. The interest related to the new year is almost entirely gone by February. You could interpret this drop as “Everyone who’s interested has already found their reading plan for the year,” or you could interpret it as, “Well, Genesis was interesting. Maybe I’ll read through the Bible next year.”
Inspired by Google Trends of Popular New Year’s Resolutions.