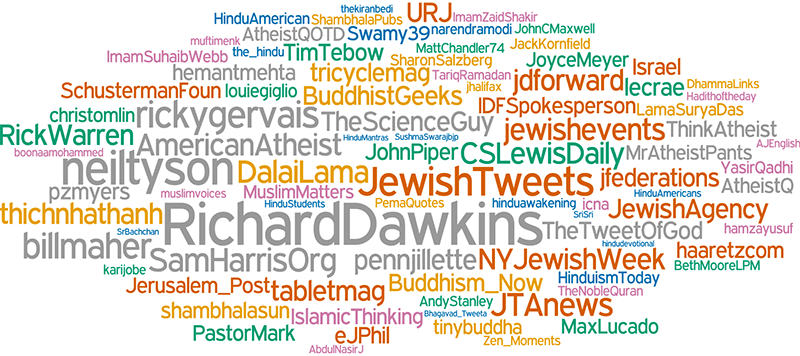
This word cloud shows the accounts that adherents to each religion are more likely to follow than people of other religions. Green is Christian, gray is atheist, orange is Jewish, pink is Muslim, yellow is Buddhist, and blue is Hindu. This figure is reproduced from the original paper.
According to the paper, here are the most-popular Twitter accounts that Christians tend to follow more than followers of other religions:
And, again according to the paper, here are the words that Christians most-commonly use in tweets compared to followers of other religions–in other words, these words serve as statistical markers of Christianity: if you use them a lot, you’re probably a Christian or hang out with Christians.
In March 2014, I wondered if it would be possible to identify and cluster the most-popular “Christian” Twitter accounts. Starting with a list of 100 Christian leaders on Twitter, I wrote a program to work through their friend lists (and then the friends of those friends, and so on), seeing who Christian leaders most tended to follow. After crunching the numbers for 13,316 users, I took the top 200 (using a PageRank algorithm) you see below.
The list contains 149 men, 23 women (by my count, all but nine–Christine Caine, Joyce Meyer, Bobbie Houston, Beth Moore, Lysa TerKeurst, Jen Hatmaker, Ann Voskamp, Sheila Walsh, and Anne Lamott–are artists or wives of prominent Christian men; the remainder are speakers or writers), 22 organizations, and 6 quote accounts (two for C.S. Lewis and one each for Tim Keller, A.W. Tozer, Charles Spurgeon, and Henri Nouwen).
Originally I wanted to cluster them (pastors, artists, etc.), but the math didn’t produce strong clusters except to identify the spam accounts (most of them spouting random Bible verses).
Here are the top 200 “Christian Twitterati” in March 2014, along with their descriptions as they appeared at that time.
| Rank |
Account |
Name |
Type |
Description (March 2014) |
| 1. |
RickWarren |
Rick Warren |
male |
No socks. Loves Jesus & people.Mentors young leaders. Helps the poor, sick & lost thru P.E.A.C.E. Plan. Serves Saddleback. Encourages pastors. Wrote some books |
| 2. |
louiegiglio |
Louie Giglio |
male |
Happy to be a door holder. |
| 3. |
MattChandler74 |
Matt Chandler |
male |
Grace addict, husband to @laurenchandler, father of three, Lead Pastor @villagechurchtx, President @Acts29 Church Planting Network |
| 4. |
joelhouston |
Joel Timothy Houston |
male |
Gracious fury, written in my saviours scars; Mercy Mercy, now engraved upon my heart. ZION – 26 • 2 • 13 |
| 5. |
shelleygiglio |
shelley giglio |
female |
part of the 268generation… |
| 6. |
lecrae |
Lecrae |
male |
Booking: Mike infocmg@wmeentertainment.com Larry larryshields@theagencygroup.com |
| 7. |
timkellernyc |
Timothy Keller |
male |
This is Timothy Keller. Sometimes my son and others post here as well. Founder of Redeemer Presbyterian Church and City to City. Husband to Kathy. |
| 8. |
BrianCHouston |
Brian Houston |
male |
My wife and I are pastors and founders of a church called Hillsong. We are pretty passionate about our family, the Church, & helping people any way we can! |
| 9. |
DarleneZschech |
Darlene Zschech |
female |
Married 2 Mark, Mum 2 Amy& Andrew, Chloe & Zoe, Grammie 2 Ava Pearl, Roman Emmanuel & Ruthie Feather,committed 2 serving Christ & worshipping Him with all I am. |
| 10. |
christynockels |
Christy Nockels |
female |
Wife! Mother, singer, poet, songwriter |
| 11. |
ChristineCaine |
Christine Caine |
female |
Follower of Jesus Christ. |
| 12. |
CTmagazine |
Christianity Today |
organization |
Christianity Today is the source for those eager to engage the world for Christ and curious about the people, events, and trends shaping the church and culture. |
| 13. |
CSLewisDaily |
C. S. Lewis |
quotes |
C. S. Lewis Quotes – Everyday |
| 14. |
christomlin |
Chris Tomlin |
male |
husband, father, songwriter |
| 15. |
MaxLucado |
Max Lucado |
male |
i played tuba in the High School marching band. been trying to stay in step with the music ever since. |
| 16. |
drmoore |
Russell Moore |
male |
President, Ethics & Religious Liberty Commission |
| 17. |
PastorMark |
Mark Driscoll |
male |
A nobody trying to tell everybody about Somebody. |
| 18. |
edstetzer |
Ed Stetzer |
male |
Christian, hubby, #DadOf3Girls, pres of @LifeWayResearch, missiologist, @GoGraceChurch pastor. Too loud. Fast talker. Sry I can’t read/reply to all msgs & DMs. |
| 19. |
passion268 |
Passion Conferences |
organization |
A student movement inspiring a generation to live for what matters most. [Isa. 26:8] |
| 20. |
bradlomenick |
Brad Lomenick |
male |
leading the charge on CATALYST (@CatalystLeader), a movement of young leaders |
| 21. |
craiggroeschel |
Craig Groeschel |
male |
Husband, Dad, Pastor of LifeChurch.tv |
| 22. |
mattmahermusic |
Matt Maher |
male |
newfoundland to phoenix to nashville to ________ |
| 23. |
AndyStanley |
AndyStanley |
male |
Do more. Give more. Be Rich. |
| 24. |
crowdermusic |
David Crowder |
male |
|
| 25. |
matt_redman |
Matt Redman |
male |
Husband, Father, Songwriter |
| 26. |
israelhoughton |
israelhoughton |
male |
Husband, Father, Friend of God. |
| 27. |
bubbawatson |
bubba watson |
male |
Christian. Husband. Daddy. Pro Golfer. Check out BubbaGolf on iTunes! #bubbagolf #urwelcome |
| 28. |
judahsmith |
Judah Smith |
male |
Lead Pastor at @thecitychurch, husband, father, and golfer. http://t.co/2xyMToSx6q |
| 29. |
BillHybels |
Bill Hybels |
male |
Sr. Pastor of Willow Creek, convener of The Global Leadership Summit, passionate about the local church, author, speaker, sailor, and grandfather to Henry & Mac |
| 30. |
reuben_morgan |
Reuben Morgan |
male |
writer+believer. thankful to be here now on a mission with people I love |
| 31. |
JohnPiper |
John Piper |
male |
Founder-Teacher, Desiring God, Chancellor, BCS. Spreading a passion for the supremacy of God in all things for the joy of all peoples through Jesus Christ. |
| 32. |
carllentzNYC |
carl lentz |
male |
HILLSONGNYC..if you don’t know, now you know… |
| 33. |
JoyceMeyer |
Joyce Meyer |
female |
Sharing Christ – Loving People |
| 34. |
jdgreear |
J.D. Greear |
male |
Lead Pastor of the Summit Church. Husband to Veronica, dad of Kharis, Allie, Ryah and Adon. Author of ‘Gospel.’ Not ‘the’ gospel, but a book about it. Rom 1:16. |
| 35. |
kpstanfill |
Kristian Stanfill |
male |
#Passion2014 // Atlanta Jan 17-18 // Houston Feb 14-15 // two cities…one heartbeat. |
| 36. |
bobbiehouston |
Bobbie Houston |
female |
Wife of Brian, mum of Joel/Esther/Ben/Luc/Laura/Pete, Grammie of Sav, Lexi,Bailey, Willow,Jack,ZIon. Grateful follower of Christ! |
| 37. |
stevenfurtick |
Steven Furtick |
male |
Pastor of Elevation Church. New book – CRASH THE CHATTERBOX – now available |
| 38. |
donaldmiller |
Donald Miller |
male |
Founder of StoryBrand, a process that helps companies speak clearly to their customers. Husband to @queenboots. |
| 39. |
Jentezen |
Jentezen Franklin |
male |
|
| 40. |
DailyKeller |
Tim Keller Wisdom |
quotes |
Fan Promo Site for Tim Keller @timkellernyc. Tweeting all things Keller and Gospel related – Books, Quotes, News, Blogs, Updates, and Kindle Deals Daily. |
| 41. |
LisaBevere |
Lisa Bevere |
female |
A woman w/a weapon who wants to be sure every girl has a sword. Author-Advocate & Speaker. Wife of John Bevere-mother of 4 sons-Gmama of 2+. |
| 42. |
BethMooreLPM |
Beth Moore |
female |
Crazy about Jesus. Saved my life. Want to see people know Him and love Him. |
| 43. |
nickygumbel |
Nicky Gumbel |
male |
Husband of @pippagumbel, Vicar of @htbchurch & pioneer of @alphacourse. Pippa & I write a daily Bible commentary http://t.co/y7xmCjzhta #BiOY #Alpha #TryAlpha |
| 44. |
davidnasser |
David Nasser |
male |
Husband,father, author, speaker, pastor… |
| 45. |
darrinpatrick |
Darrin Patrick |
male |
Son, Husband, Father, Pastor, Chaplain to the St Louis Cardinals – Author of The Dude’s Guide to Manhood |
| 46. |
TGC |
The Gospel Coalition |
organization |
TGC exists to promote gospel-centered ministry for the next generation. |
| 47. |
LigonDuncan |
Ligon Duncan |
male |
Chancellor/CEO of the Reformed Theological Seminary system @ReformTheoSem and John E. Richards Professor of Systematic and Historical Theology |
| 48. |
JohnCMaxwell |
John C Maxwell |
male |
Bestselling author & speaker on leadership. Christian. Blogger. Trainer. Coach. Assisted by Stephanie Wetzel (SW). |
| 49. |
DaveRamsey |
Dave Ramsey |
male |
New York Times best-selling author and host of The Dave Ramsey Show. Follow the rest of my team at @RamseyShow, @DaveRamseyLIVE, and @EntreLeadership |
| 50. |
michaelwsmith |
Michael W. Smith |
male |
New single YOU WON’T LET GO now available EVERYWHERE! From the new Michael W. Smith album, SOVEREIGN available everywhere May 13, 2014! |
| 51. |
HarrisJosh |
Joshua Harris |
male |
Pastor @Covenantlife. In love with Shannon. Three awesome kids. Learning to be a disciple of Jesus day by day. Written some books. |
| 52. |
TimTebow |
Tim Tebow |
male |
Blessed |
| 53. |
TripLee116 |
Trip Lee |
male |
Rapper, Author. Living by faith in a good God. The Good Life Album and Book are in stores now |
| 54. |
Chris_Hodges |
Chris Hodges |
male |
Follower of Jesus, husband, dad, senior pastor of Church of the Highlands, author of Fresh Air. |
| 55. |
rayortlund |
Ray Ortlund |
male |
|
| 56. |
greglaurie |
Greg Laurie |
male |
Pastor and Evangelist :: Knowing God and Making Him Known :: Maintained by Pastor Greg and the Harvest Web Team |
| 57. |
perrynoble |
Perry Noble |
male |
Senior Pastor of @NewSpring. Author of Unleash! and Overwhelmed. |
| 58. |
EdYoung |
Ed Young |
male |
I’m Ed Young, husband, father of four and the senior pastor of Fellowship Church, located in Dallas/Ft. Worth, TX; Miami, FL; Columbia, SC; and London, England. |
| 59. |
PaulTripp |
Paul David Tripp |
male |
Pastor. Author. Conference Speaker. Connecting the transforming power of Jesus Christ to everyday life. |
| 60. |
MarkBatterson |
Mark Batterson |
male |
Lead Pastor, National Community Church in Washington DC. Author, The Circle Maker, All In, In a Pit with a Lion on a Snowy Day, Wild Goose Chase, Soulprint… |
| 61. |
hillsongunited |
Hillsong United |
organization |
White Album avalaible for pre purchase – http://t.co/tOkODeCkb7 |
| 62. |
karijobe |
Kari Jobe |
female |
Worshipper. Girly-girl. Longboard skateboard-er. World traveller. Random tweeter. Songwriter. I love life and Jesus. MAJESTIC CD/DVD will release March 25! |
| 63. |
BishopJakes |
TD Jakes |
male |
Official Twitter for Bishop T. D. Jakes |
| 64. |
albertmohler |
albertmohler |
male |
President @sbts; author; broadcaster; theologian |
| 65. |
TozerAW |
A W Tozer |
quotes |
Inspiring, encouraging and challenging quotes from the new works of AW Tozer–including My Daily Pursuit–and a few of his classic quotes. |
| 66. |
CSLewisU |
C. S. Lewis |
quotes |
Daily Thoughts and ideas from CS Lewis |
| 67. |
JudWilhite |
Jud Wilhite |
male |
Senior Pastor at @centralonline. Married to @Lori_Wilhite with 2 kids. New York Times Best-Selling author. Espresso addict & Dallas Cowboys fan. |
| 68. |
PriscillaShirer |
Priscilla Shirer |
female |
Just a girl….with a Sword |
| 69. |
jamesmacdonald |
James MacDonald |
male |
Revelation 1:2 – For the Word of God and the testimony of Jesus Christ |
| 70. |
ScottyWardSmith |
Scotty Smith |
male |
Founding Pastor of Christ Community Church. Husband, dad, granddad, lover of the gospel, photographer, fisherman, and so blessed |
| 71. |
dinorizzo |
Dino Rizzo |
male |
Husband to DeLynn, father to three awesome kids, and author of the book Servolution. |
| 72. |
plattdavid |
David Platt |
male |
Husband to Heather. Dad to Caleb, Joshua, Mara Ruth, & Isaiah. Pastor of The Church at Brook Hills. |
| 73. |
JosephPrince |
Joseph Prince |
male |
It’s my passion to share God’s grace radically & see lives gloriously transformed! |
| 74. |
between2worlds |
BetweenTwoWorlds |
male |
Justin Taylor: Christian, husband, father, elder, acquisitions editor, blogger |
| 75. |
desiringgod |
Desiring God |
organization |
We want people everywhere to understand and embrace the truth that *God is most glorified in us when we are most satisfied in him* |
| 76. |
MarkDever |
Mark Dever |
male |
|
| 77. |
CJMahaney |
C.J. Mahaney |
male |
Prone to wander, Lord, I feel it, Prone to leave the God I love; Here’s my heart, O take and seal it, Seal it for Thy courts above. |
| 78. |
RevKevDeYoung |
Kevin DeYoung |
male |
Senior Pastor, University Reformed Church. Married to Trisha. Five children. Christian. |
| 79. |
ThabitiAnyabwil |
Thabiti Anyabwile |
male |
Foreknown, predestined, called, justified, glorified. Hubby to Kristie, daddy to 3, Pastor of FBC, satisfied in Christ. |
| 80. |
GabeLyons |
Gabe Lyons |
male |
|
| 81. |
JeffersonBethke |
Jefferson Bethke |
male |
I like to drink coffee, create stuff, & sleep. Husband to @alyssajoybethke & Co-Founder of @clarocandles. Author of this — http://t.co/wLOFZhkjh1 |
| 82. |
jackngraham |
Jack Graham |
male |
Husband to Deb. Dad to Jason, Kelly, Josh. Dad in love 2 Toby, Kaytie. Grandad to Ian, Dylan, Levi. Pastor Prestonwood. |
| 83. |
bobgoff |
Bob Goff |
male |
Author of Love Does. President and Founder, Restore International |
| 84. |
CatalystLeader |
Catalyst |
organization |
A Convergence of Next Generation Leaders |
| 85. |
KayWarren1 |
Kay Warren |
female |
Mom of 3,Grammy of 5, pastor’s wife, speaker, author,& advocate for those living with HIV, mental illness & 4 orphans. Determined 2 say yes to God, 2 choose joy |
| 86. |
TonyDungy |
Tony Dungy |
male |
Husband to @LaurenDungy, father of nine, author (http://t.co/mOupp6iBLw), retired NFL coach, National Spokesman for @AllProDad. Live by Mark 8:36 |
| 87. |
mandisaofficial |
Mandisa |
female |
Jesus-follower. Contemporary Christian recording artist. Author. American Idol Season 5 finalist. Picture of health wrapped in a not-so-perfect tent…for now! |
| 88. |
macpowell |
Mac Powell |
male |
Lead Singer of Third Day. Solo Country Project now available! |
| 89. |
JohnBevere |
John Bevere |
male |
Husband of Lisa. Father to Addison & Juli, Austin, Alec, & Arden + G-Daddy to Asher & Baby Sophia! Author & Ambassador of Jesus Christ. |
| 90. |
pwilson |
Pete Wilson |
male |
Pastor of @crosspoint_tv in Nashville, author of #LetHopeIn, husband, and father of 3 boys. |
| 91. |
richwilkersonjr |
Rich Wilkerson Jr. |
male |
Married to the greatest lady in the world. Young adult pastor of The Vous (http://t.co/P23VgE2sqM) |
| 92. |
laurenchandler |
Lauren Chandler |
female |
wife to matt. mother to audrey, reid + norah. lover of God. singer of songs. writer of stuff. |
| 93. |
AndyMineo |
Andy Mineo |
male |
-|| Artist | Unashamed | #116 | Never Land EP & Heroes For Sale out now! ||- Booking (WME): http://t.co/0B2UdfwgWx |
| 94. |
Spurgeon_ |
Charles Spurgeon |
quotes |
|
| 95. |
theResurgence |
Resurgence |
organization |
Resurgence serves the church on mission by creating tools, training believers & connecting leaders. Sign up for our Resurgence conference http://t.co/A8kt1gsbwW |
| 96. |
RealJohnGray |
John Gray |
male |
Aventer’s husband. John IV and Theory’s dad. Alice’s son. God’s Servant. Associate Teaching Pastor, Lakewood Church. |
| 97. |
stovallweems |
Stovall Weems |
male |
|
| 98. |
drtonyevans |
Tony Evans |
male |
Serving my Savior and my King. #KingdomMan #KingdomAgenda |
| 99. |
JustinHolcomb |
Justin Holcomb |
male |
Episcopal priest, professor, & author |
| 100. |
MatthewBarnett |
Matthew Barnett |
male |
Pastor of The Dream Center & Angelus Temple. Pre-order my new book “God’s Dream For You” -http://t.co/tCqS3DA2wT – Follow me on Instagram http://t.co/8SovoK95h3 |
| 101. |
TheA21Campaign |
The A21 Campaign |
organization |
We abolish human trafficking in the 21st century. |
| 102. |
kevingerald |
Kevin Gerald |
male |
Leader, wife-lover, Jesus follower. http://t.co/sYxprXXCKS |
| 103. |
randyalcorn |
Randy Alcorn |
male |
Author of over forty books, founder of Eternal Perspective Ministries; love Jesus, my wife Nanci, daughters, sons and five grandsons! |
| 104. |
collinhansen |
Collin Hansen |
male |
Editorial Director for The Gospel Coalition, Author of ‘A God-Sized Vision’ and ‘Young, Restless, Reformed’ |
| 105. |
jonathanfalwell |
Jonathan Falwell |
male |
Pastor of Thomas Road Baptist Church in Lynchburg, VA. |
| 106. |
RealEricGeiger |
Eric Geiger |
male |
Vice President LifeWay Christian Resources. I follow Jesus and serve His Church, love my wife and kids, and want to play more basketball. |
| 107. |
enditmovement |
❌ END IT |
organization |
Shine A Light on Slavery. |
| 108. |
kirkfranklin |
Kirk Franklin |
male |
The Official Kirk Franklin |
| 109. |
NatalieGrant |
Natalie Grant |
female |
Jesus girl. Family girl. Singer girl. Freedom fighter. |
| 110. |
PastorTullian |
Tullian Tchividjian |
male |
Pastor of @coralridgepc. Founder of @liberatenet. Grandson of @BillyGraham. Learning everyday that Jesus + Nothing = Everything. |
| 111. |
PhilCooke |
Phil Cooke |
male |
Helping churches & nonprofits not suck at the media. http://t.co/EDnq7j8qXD http://t.co/Z4XZwHOgMk Recent books: One Big Thing & Unique |
| 112. |
RaviZacharias |
Ravi Zacharias |
male |
Founder & President of Ravi Zacharias International Ministries. Atlanta | Worldwide. Helping Thinkers Believe & Believers Think. Staff assists with tweets. |
| 113. |
LysaTerKeurst |
Lysa TerKeurst |
female |
I’ve had a crush on Art for 20 years. We love 5 kids like crazy. I adore my team at Proverbs31ministries. I wrote Made to Crave, Unglued, and a few others. |
| 114. |
PsRobertMorris |
Robert Morris |
male |
Official Twitter for Robert Morris, Senior Pastor of @GatewayPeople, and the author of The Blessed Life and The Blessed Church. http://t.co/WsY79Qngh8 |
| 115. |
israelnewbreed |
israelnewbreed |
organization |
|
| 116. |
caseytreat |
Casey Treat |
male |
Senior Pastor @CFCSeattle, husband, father, friend, & author. Romans 12:2 changed my life & can change yours too. |
| 117. |
rick_bezet |
Rick Bezet |
male |
Husband to Michelle, Dad to Hunter/Hailee/Tanner/Grace! Pastor to New Life Church in AR! My dog hates me. |
| 118. |
JenHatmaker |
JenHatmaker |
female |
Wife, mama of 5 (3 the old fashioned way…2 from Ethiopia), writer, speaker, foodie, Wii Just Dance Champion, gardener, hash tag abuser, Jesus girl. |
| 119. |
JLin7 |
Jeremy Lin |
male |
to know Him is to want to know Him more |
| 120. |
BillyGraham |
Billy Graham |
male |
Official Twitter page of Rev. Billy Graham. Account is run by @BGEA staff. |
| 121. |
joechampion |
Joe Champion |
male |
Love Jesus, Love my family, Love my Church. |
| 122. |
PastorSergio |
Sergio De La Mora |
male |
Pastor of the Cornerstone Church of San Diego, Father, Husband, Visionary, Author of The Heart Revolution. |
| 123. |
realrobbell |
Rob Bell |
male |
|
| 124. |
hillsonglive |
Hillsong LIVE |
organization |
The Official Hillsong LIVE Twitter. Our latest live album #GloriousRuins is now available! http://t.co/8M8uQwehgs |
| 125. |
JoelOsteen |
Joel Osteen |
male |
Daily inspiration to help you live the life of victory and abundance that God intended for you. http://t.co/6apEukVPbT |
| 126. |
_Matt_Carter |
Matt Carter |
male |
Lover of Jesus. Husband of an amazing woman. Father to 3 delightful children. Pastor of Preaching @ The Austin Stone. Author of The Real Win w/ Colt McCoy |
| 127. |
MichaelHyatt |
Michael Hyatt |
male |
Author of the New York Times bestseller, Platform: Get Noticed in a Noisy World. Founder of http://t.co/UNZmxcFox9. Forbes Top 50 Social Media Influencer 2013 |
| 128. |
LeeStrobel |
Lee Strobel |
male |
Follower of Jesus. Husband, dad, grandfather. Author of 20+ books, including The Case for Christ & The Case for Faith. Professor at Houston Baptist University |
| 129. |
bennyperez |
Benny Perez |
male |
Husband, Father, Lead Pastor of The Church LV. Join us for @DedicatedLV in Vegas June 25th-27th. Register at http://t.co/z89UxZQAkd |
| 130. |
TroyGramling |
Troy Gramling |
male |
Husband, Father of 3, Lead #Pastor at @PotentialChurch. |
| 131. |
Pontifex |
Pope Francis |
male |
Welcome to the official Twitter page of His Holiness Pope Francis |
| 132. |
RealRomaDowney |
Roma Downey |
female |
Roma actress and producer of emmy nominated series The Bible seen by over 100 million people in USA and Son of God to be released Feb 28th 2014 |
| 133. |
bobbygwald |
Bobby Gruenewald |
male |
Pastor, Innovation Leader @ LifeChurch.tv. a founder @ http://t.co/QDlDdOyo. Passionate about my family, The Church, Leadership, Mobile Technology. |
| 134. |
DarrenWhitehead |
Darren Whitehead |
male |
Husband to Brandy. Dad to Sydney, Scarlett & Violet. Aussie. Author of Rumors of God. |
| 135. |
AnnVoskamp |
Ann Voskamp |
female |
Wife to the Farmer: Mama to 6 : Author of NYTimes Bestsellers: One Thousand Gifts … & … The Greatest Gift. Seeking to follow One alone. |
| 136. |
IJM |
Intl Justice Mission |
organization |
Official International Justice Mission twitter securing rescue for victims of slavery & other violent forms of oppression. Tweeters: Austin/Tierney/Jaclyn |
| 137. |
RevRunWisdom |
Rev Run |
male |
Words of wisdom non-stop.. Pls don’t be offended if I don’t reply or follow u, But I Love you! |
| 138. |
DannyAkin |
Daniel Akin |
male |
|
| 139. |
ahc |
Andy Crouch |
male |
Writer (Playing God, Culture Making) | Executive Editor (@CTmagazine) | Producer (@ct_city) | Dad |
| 140. |
hillsong |
Hillsong Church |
organization |
Hillsong Church is all about loving God and people. |
| 141. |
PastorChrisHill |
Chris Hill |
male |
Official Twitter for Pastor Chris Hill. Son, husband, father, friend, mentor, preacher & Senior Pastor of The Potter’s House Church of Denver. |
| 142. |
JonAcuff |
Jon Acuff |
male |
New York Times Bestselling Author of Start/Speaker. Married to Jenny. Dad to L.E. and McRae. |
| 143. |
ronniefloyd |
Ronnie Floyd |
male |
Senior Pastor of @CrossChurch, a multi campus faith family, the founder of @CCSchoolofMin. Passionate about preparing leaders for global Gospel advancement. |
| 144. |
johnnymhunt |
Johnny Hunt |
male |
Pastor of FBC Woodstock since Dec. 1986. FORMER President of the Southern Baptist Convention |
| 145. |
SheilaWalsh |
SheilaWalsh |
female |
Born in Scotland, now a US citizen, wife, mom of 1 boy and 3 pups. Overwhelmed by the fiery love and mercy of God, found it impossible to keep it to myself |
| 146. |
Crossway |
Crossway |
organization |
Crossway is a not-for-profit publisher of Christian books, the ESV Bible, and gospel tracts. Tweets by @angelacheatham and @jameskinnard [at the time tweeted as @CrosswayBooks] |
| 147. |
bilcornelius |
Bil Cornelius |
male |
Leader/founding pastor/speaker/author/entrepreneur I love Jesus, @jesicacornelius,my 3 kids, @bafchurch, & people.I could eat Mexican food 5 days a week. |
| 148. |
9MarksOnline |
9Marks |
organization |
9Marks exists to equip church leaders with a biblical vision and practical resources for displaying God’s glory to the nations through healthy churches. |
| 149. |
RichWilkerson |
Rich Wilkerson |
male |
Pastor @TrinityMiami husband of 1 wife Robyn 4 sons 2 daughters 1 GrandDarling… Love God & Love Ppl |
| 150. |
KerryShook |
Kerry Shook |
male |
Senior pastor of @WoodlandsChurch. Husband to the beautiful @ChristineShook. Dad to Ryan, Josh, Megan & Steven. NY Times Bestselling author. |
| 151. |
gregsurratt |
Greg Surratt |
male |
Pastor – Seacoast Church |
| 152. |
TommyTenney |
Tommy Tenney |
male |
Happy husband to the ever amazing @JeannieTenney • Father to 3 delightful daughters • Blessed with 4 grandchildren • Son of @TFTenney • Christ follower • Cajun |
| 153. |
scotmcknight |
scotmcknight |
male |
Professor @nseminary |
| 154. |
DrHenryCloud |
Dr. Henry Cloud |
male |
Psychologist, Author, and Leadership Consultant. http://t.co/haDxnxImhX |
| 155. |
mattfry |
Matt Fry |
male |
Lead Pastor C3 Church http://t.co/Pr8QOnjHgq ARC Lead Team http://t.co/wtA6HwBOFi |
| 156. |
pastoremase |
Eric Mason |
male |
Jesus follower, Husband of @ImmNehe, Father, Pastor @epiphfellowship Author of #ManhoodRestored |
| 157. |
bibleseries |
The Bible’ Series |
organization |
The Bible’ is an epic journey from Genesis through Revelation produced by Roma Downey & Mark Burnett. Emmy nominated & seen by 100 million people & counting! |
| 158. |
tommybarnett |
Tommy Barnett |
male |
Senior Pastor, Phoenix First Assembly in Phoenix (http://t.co/jUYIccxdTd), Arizona; co-founder of the LA Dream Center and NY Dream Center |
| 159. |
ericmetaxas |
Eric Metaxas |
male |
is the author of BONHOEFFER: Pastor, Martyr, Prophet, Spy and AMAZING GRACE: William Wilberforce & the Heroic Campaign to End Slavery. |
| 160. |
FirstLadyJakes |
Serita Jakes |
female |
Official Twitter for First Lady Serita Jakes |
| 161. |
erwinmcmanus |
Erwin McManus |
male |
traveling the universe with my band of outsiders in search of beauty, wonder, and a good story. |
| 162. |
johnortberg |
John Ortberg |
male |
Author Speaker Pastor |
| 163. |
Fred_Buechner |
Frederick Buechner |
male |
Christian theologian and author of 36 books, including fiction, autobiography, essays, sermons, quotes, and other nonfiction. |
| 164. |
hillsongNYC |
Hillsong NYC |
organization |
The best way to stay in touch with what’s happening in Hillsong NYC! Also, check out – http://t.co/3WbMj7pyX8 and http://t.co/X7ytKmHdiE |
| 165. |
jrvassar |
JR Vassar |
male |
Christ follower, Husband, Father, Pastor. |
| 166. |
ANNELAMOTT |
ANNE LAMOTT |
female |
Author – Bird by Bird, Traveling Mercies, Some Assembly Required, Help Thanks Wow. Mom, Nana, activist; elder at St. Andrew Prez–services at 11:00. |
| 167. |
RedeemerNYC |
Redeemer Pres NYC |
organization |
|
| 168. |
RichStearns |
Rich Stearns |
male |
President of World Vision USA, and author of The Hole in Our Gospel and Unfinished: Believing Is Only the Beginning (April, 2013) |
| 169. |
ihoughton |
Israel Houghton |
male |
Husband, Father,Friend of God |
| 170. |
LarryOsborne |
Larry Osborne |
male |
Pastor, Author – North Coast Church, Vista CA Blog:http://t.co/cybdjDrxo6 |
| 171. |
PastorChrisSeay |
Chris Seay |
male |
Pastor of Ecclesia Houston, President of Ecclesia Bible Society/Translator of The Voice ( a beautiful and faithful translation of scriptures), Husband and Dad |
| 172. |
charitywater |
charity: water |
organization |
We’re an NYC-based charity working in 20 developing countries around the world, bringing clean water to people in need. |
| 173. |
Michael_Card |
Michael Card |
male |
Christian Author, Singer/ Songwriter. Written 23 books and 30 albums Well known and loved through songs like El Shaddai, Immanuel and Come Lift Up Your Sorrows |
| 174. |
CharlesJenkins7 |
Charles Jenkins |
male |
I laugh I serve I create I give |
| 175. |
dancathy |
Dan T. Cathy |
male |
CEO and President of Chick-fil-A, but I like to say I’m in Customer Service |
| 176. |
kimwalkersmith |
Kim Walker-Smith |
female |
I love Jesus, Skyler (my knight-in-shining-armor), Wyatt (my wildly handsome son), Duke & Stella (my cuddly dogs), and chocolate. In that order. |
| 177. |
RELEVANT |
RELEVANT Magazine |
organization |
The leading magazine on faith, culture & intentional living. Covering what’s relevant to your life—in print, iPad & daily online. (Founded by @CameronStrang.) |
| 178. |
tonymorganlive |
Tony Morgan |
male |
I help leaders and organizations get unstuck. |
| 179. |
therealtobymac |
TobyMac |
male |
I got my eye on it!! |
| 180. |
Clayton_king |
Clayton King |
male |
Founder & President of Crossroads Ministries, Teaching Pastor @ Newspring Church, Campus Pastor @ Liberty University, Author for Lifeway & Baker Pub |
| 181. |
JeanneMayo |
Jeanne Mayo |
female |
Wife + Mom + Nana + Coach + Author + Speaker + Cadre + Atlanta Leadership College + 212 Director = Love to Meet You!! #follow #StuMin @YLCoach |
| 182. |
jaredcwilson |
jaredcwilson |
male |
Husband, father, pastor, author. My latest book STORYTELLING GOD available now from Crossway. |
| 183. |
JonTyson |
Jon Tyson |
male |
Trinity Grace Church : City Collective : City Renewal. Planting in Midtown Manhattan. Pursuing the way of Jesus : Joining God in the renewal of all things. |
| 184. |
brandonheath |
Brandon Heath |
male |
Don’t miss Brandon on #HitsDeepTour and check out his album Blue Mountain on iTunes http://t.co/WnmvSIeP3E |
| 185. |
jamiemunson |
Jamie Munson |
male |
CoPresident of @Storyville Coffee, Writer at http://t.co/IDic6PFedy, Author of 2 Books – Authority and Money |
| 186. |
BurkParsons |
Burk Parsons |
male |
I’m not my own but belong to Jesus Christ whom I trust, follow, and preach as an ordinary pastor, dad, and husband making disciples of nations for God’s glory. |
| 187. |
philwickham |
Phil Wickham |
male |
The Ascension now available on iTunes! http://t.co/fMqmAHW5bS |
| 188. |
HenriNouwen |
Henri Nouwen |
quotes |
Henri Nouwen – author, theologian, mentor, pastor, activist, Dutch priest, and above all – beloved. |
| 189. |
MikeFoster |
Mike Foster |
male |
Lover of imperfectionists. Founder of @POTSC. Author of Freeway: A Not-So-Perfect Guide To Freedom. I believe in love, God and you. |
| 190. |
cameronstrang |
Cameron Strang |
male |
Founder of @RELEVANT, daddy of Cohen, follower of Jesus, publisher, podcaster, fan of the Magic & Gators. But not in that order. |
| 191. |
bloodwater |
Blood:Water |
organization |
Partnering with Africa to end the HIV/AIDS & water crises |
| 192. |
jonforeman |
Jon Foreman |
male |
I play music in bands called switchfoot, and fiction family. I am grateful to be alive. |
| 193. |
JonathanMerritt |
Jonathan Merritt |
male |
Senior Columnist, Religion News Service @RNS; Author of A Faith of Our Own (2012) and Jesus is Better Than You Imagined (2014) |
| 194. |
loswhit |
Carlos Whittaker |
male |
Author of Moment Maker :: Hater of Meatloaf :: Lover of Familia |
| 195. |
DanKimball |
Dan Kimball |
male |
on staff at Vintage Faith Church, author of They Like Jesus But Not The Church |
| 196. |
stevekmccoy |
Steve K. McCoy |
male |
I’ve heard and I believe. I study and I preach. I imagine and I create. I am loved and I love. |
| 197. |
challies |
challies |
male |
Owner and proprietor of http://t.co/UVIRyi9y. |
| 198. |
lovedoes |
Love Does |
organization |
|
| 199. |
williebosshog |
Willie Robertson |
male |
President of Duck and Buck Commander. Personality on both, Duck Dynasty and Buck Commander Protected by Under Armour. |
| 200. |
coltondixon |
Colton Dixon |
male |
love God. love music. love people |