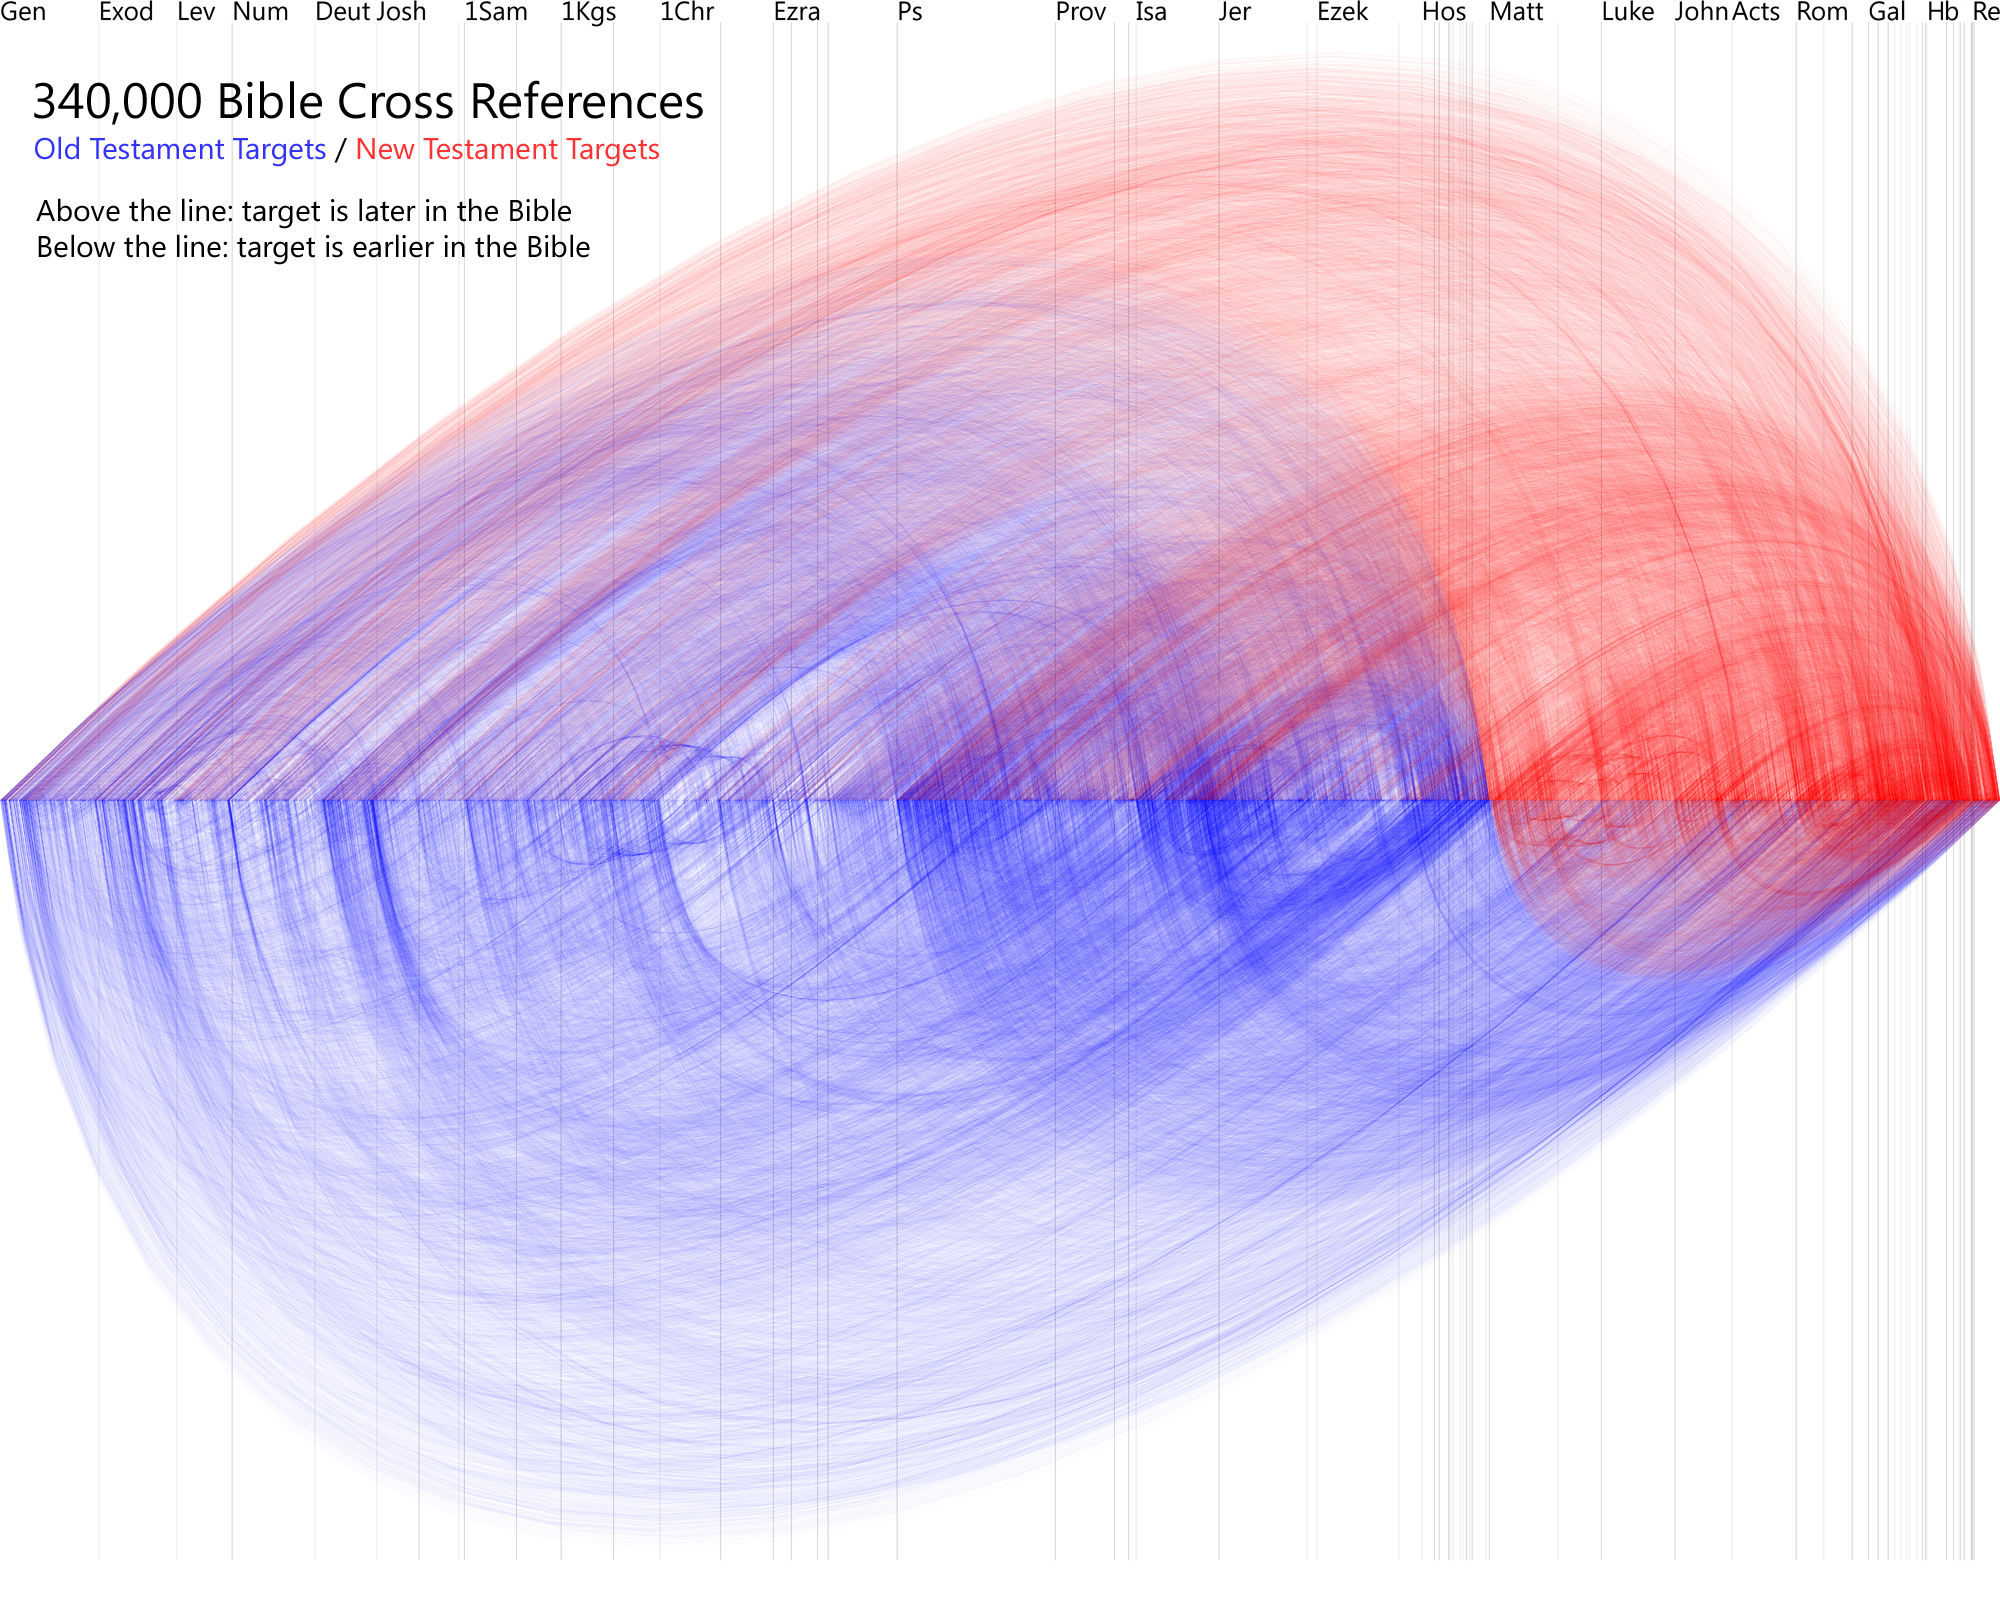
Here’s a visualization of 340,000 Bible cross references:
 Larger version (2,000 x 1,600 pixels).
Does anything strike you as intriguing? A few trends jump out at me:
- The frequency of dense New Testament streaks in the Old Testament, especially in Leviticus and Deuteronomy; I didn't expect to see them there.
- The loops in Samuel / Kings / Chronicles and in the Gospels indicating parallel stories.
- The sudden increased density of New Testament references in Psalms through Isaiah.
- The eschatological references in Isaiah and Daniel.
- The density of references from the Minor Prophets back to both the Major Prophets and earlier in the Old Testament.
- The surprising density of cross references in Hebrew-Jude.
- The asymmetry. If verse A cites verse B, verse B doesn't necessarily cite verse A. I wonder if I should make the data symmetrical.
You can also download the full-size image (10,000 x 8,000 pixels, 75 MB PNG). It’s a very large image that could crash your browser. If you want it, I strongly recommend that you save it to your computer rather than trying to open it in your browser.

This visualization uses data from the Bible Cross References project. I used PHP’s GD library to create the graphic.
Inspired by Chris Harrison and Christian Swinehart’s wonderful Choose Your Own Adventure work.
openbible