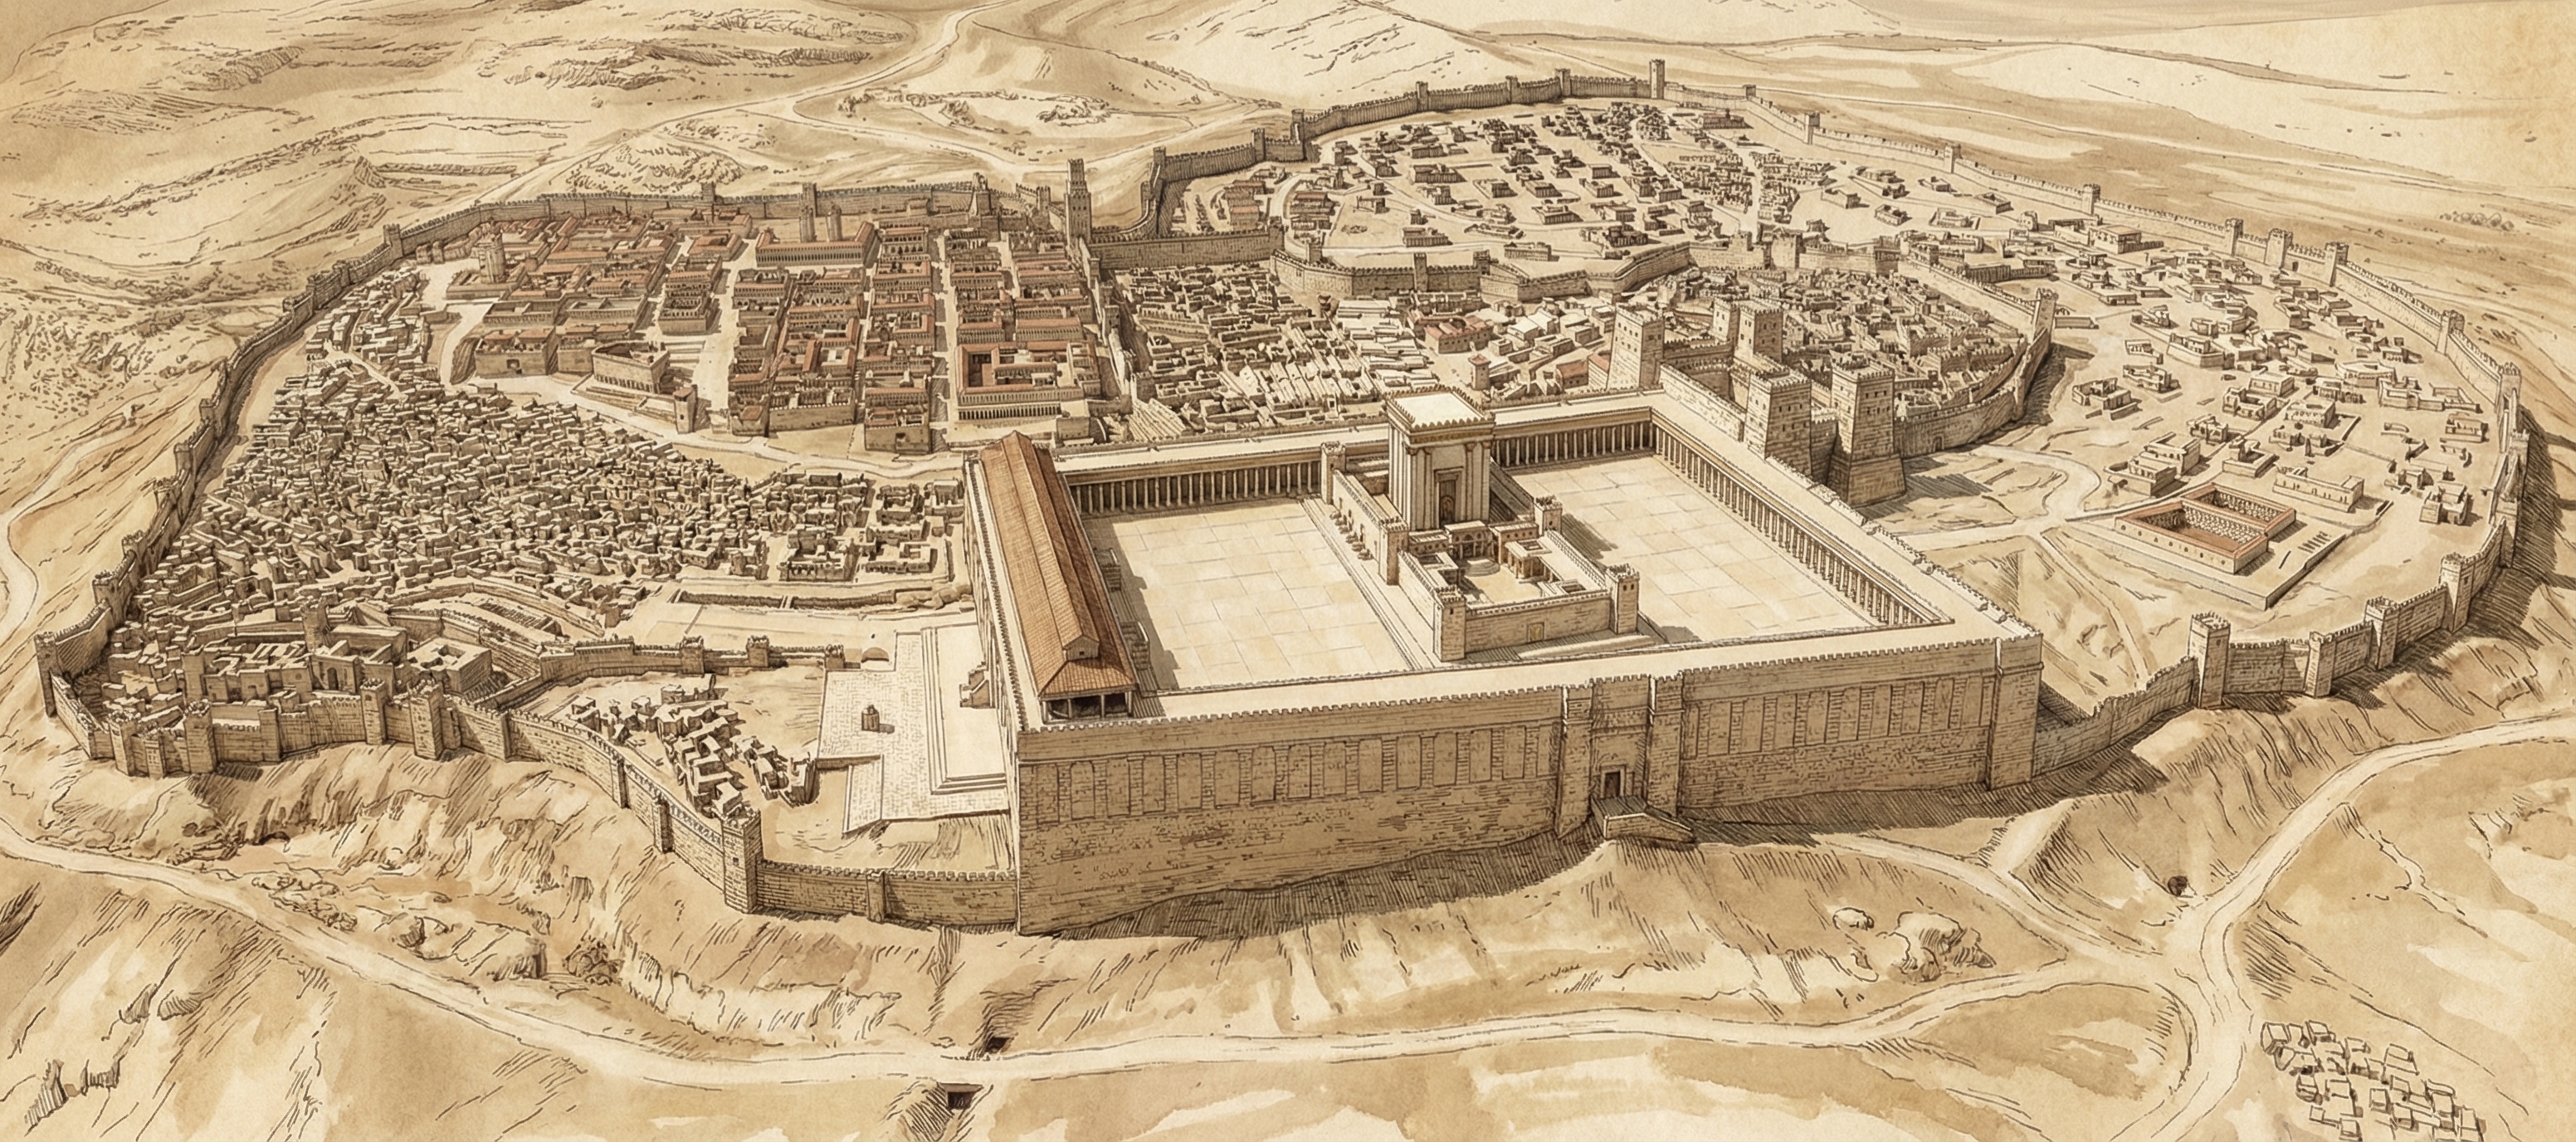
I recently wrote about using Opus 5 to create a 3D model of Herod’s Temple. Now GPT-6 Astra is out, and OpenAI is trumpeting how well it uses Blender. They’re right.
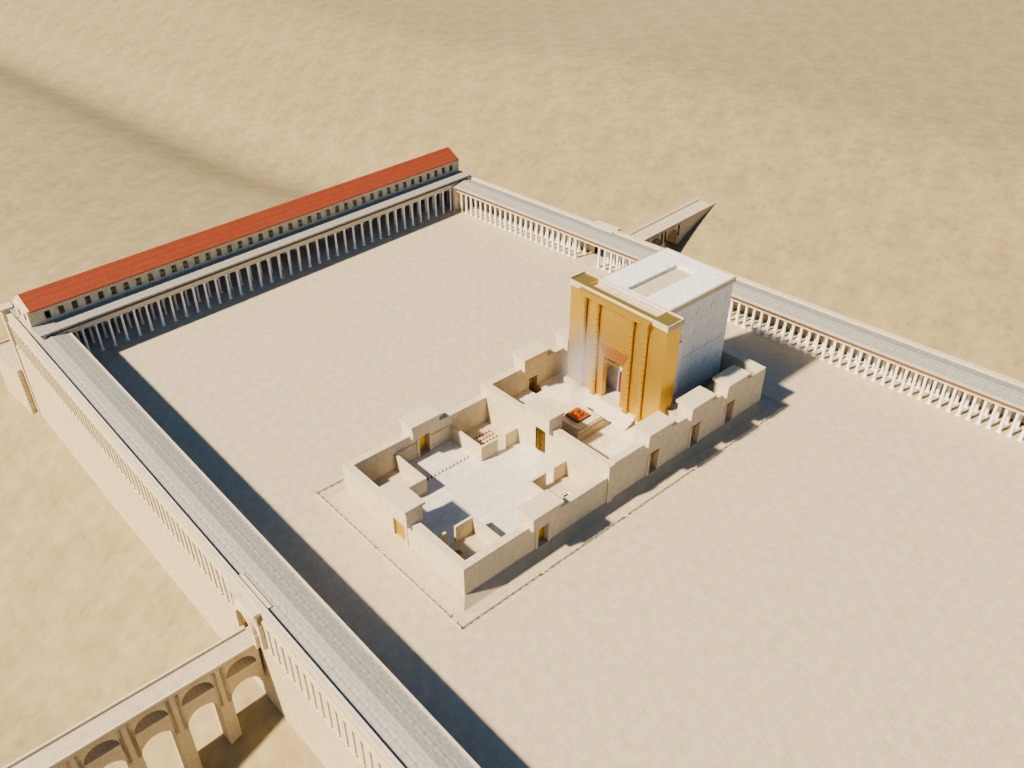
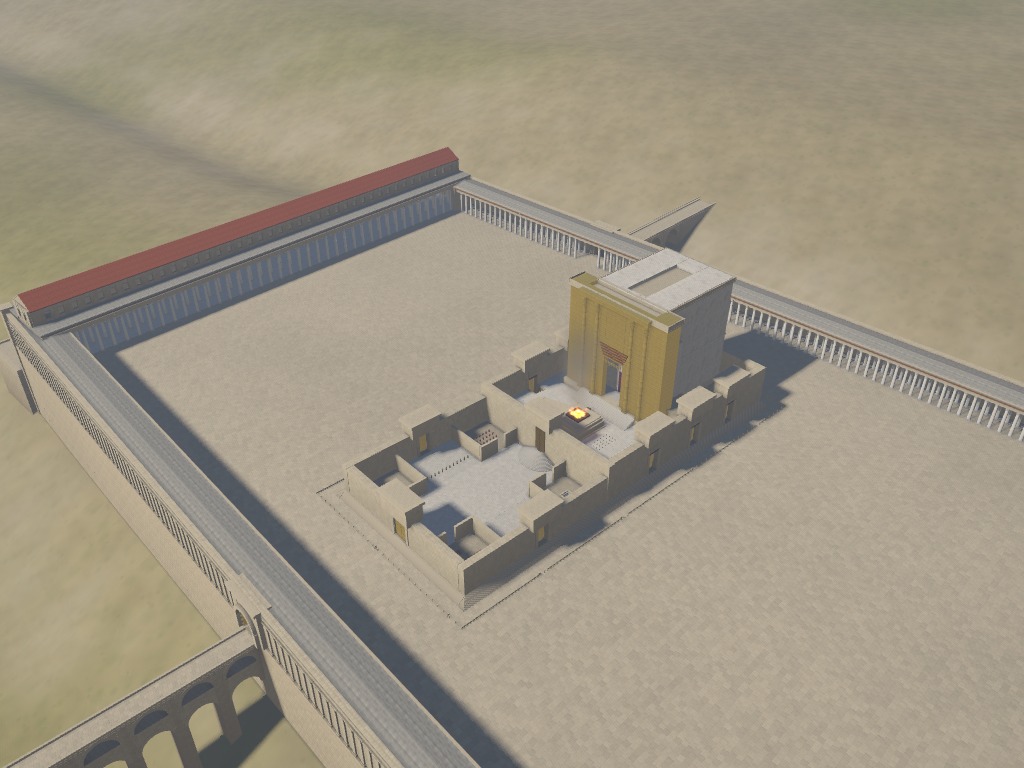
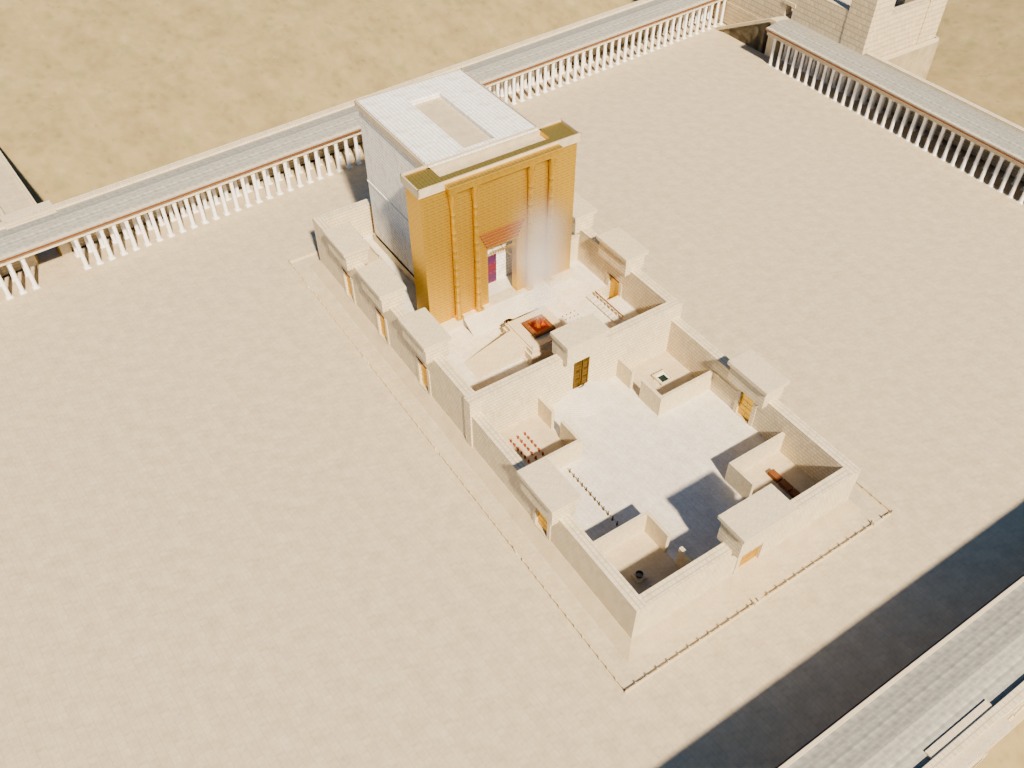
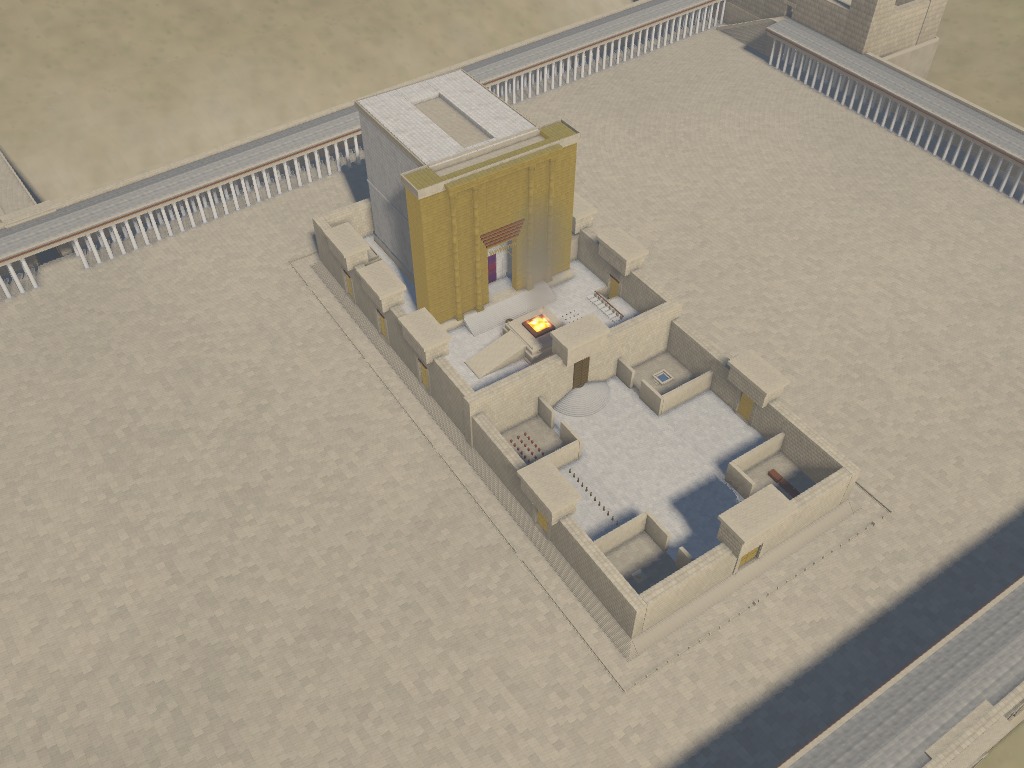
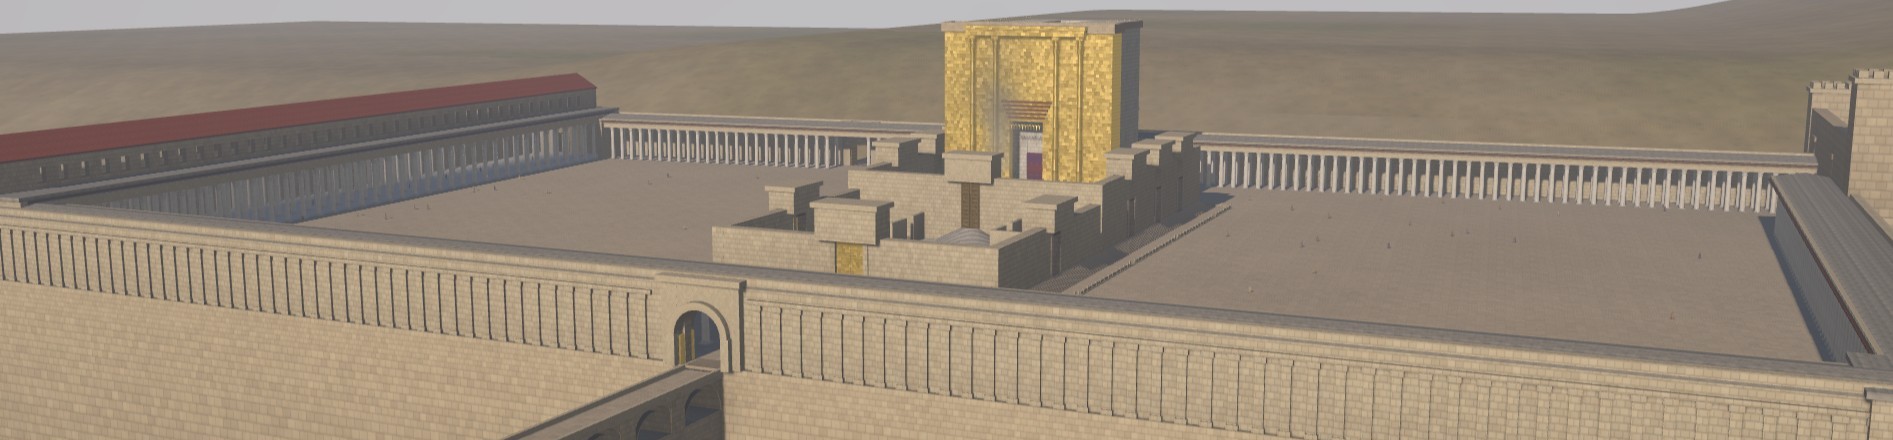
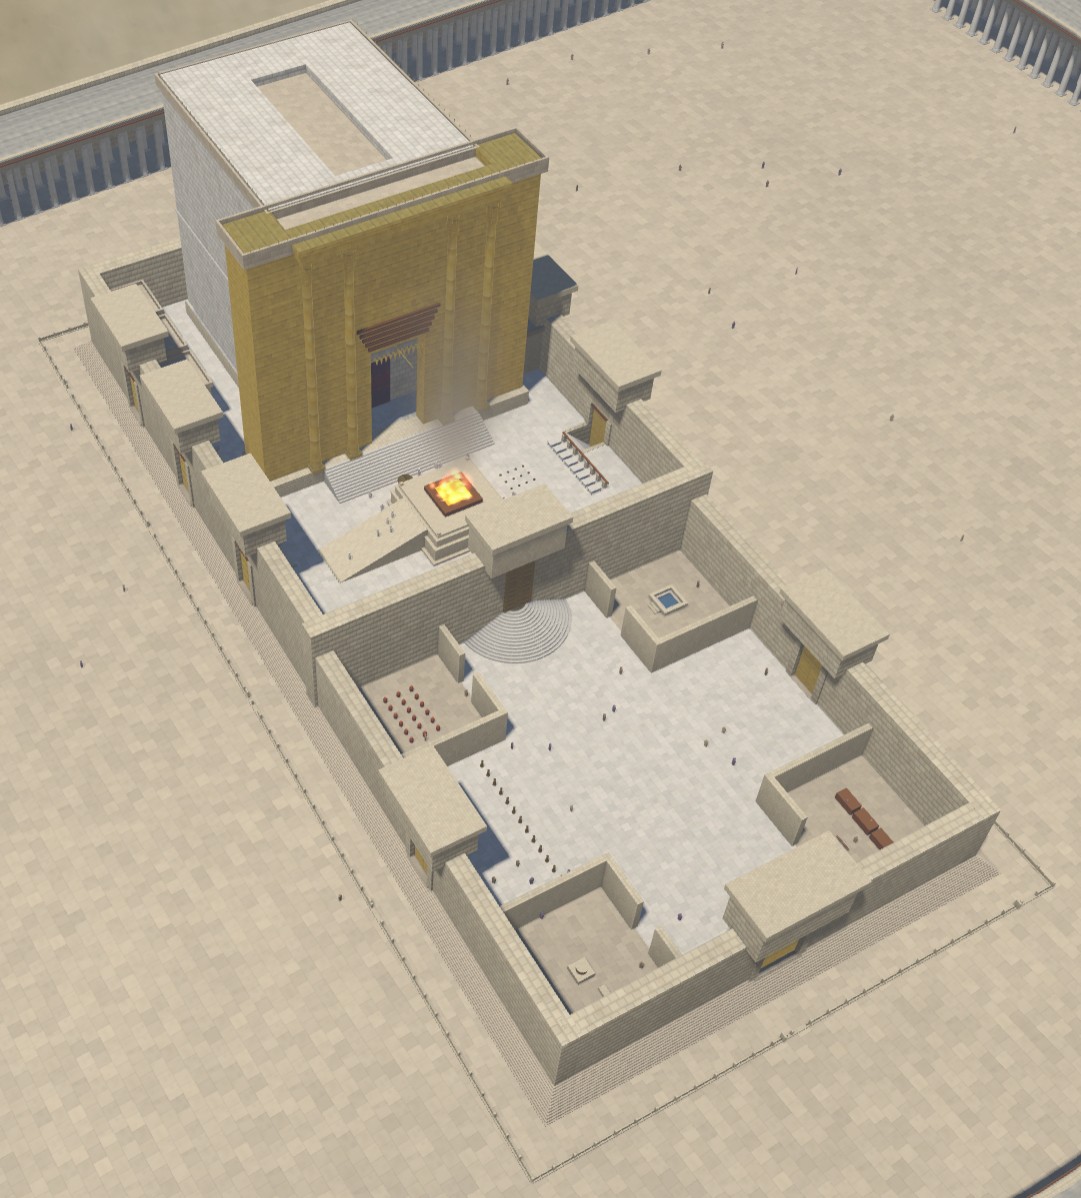
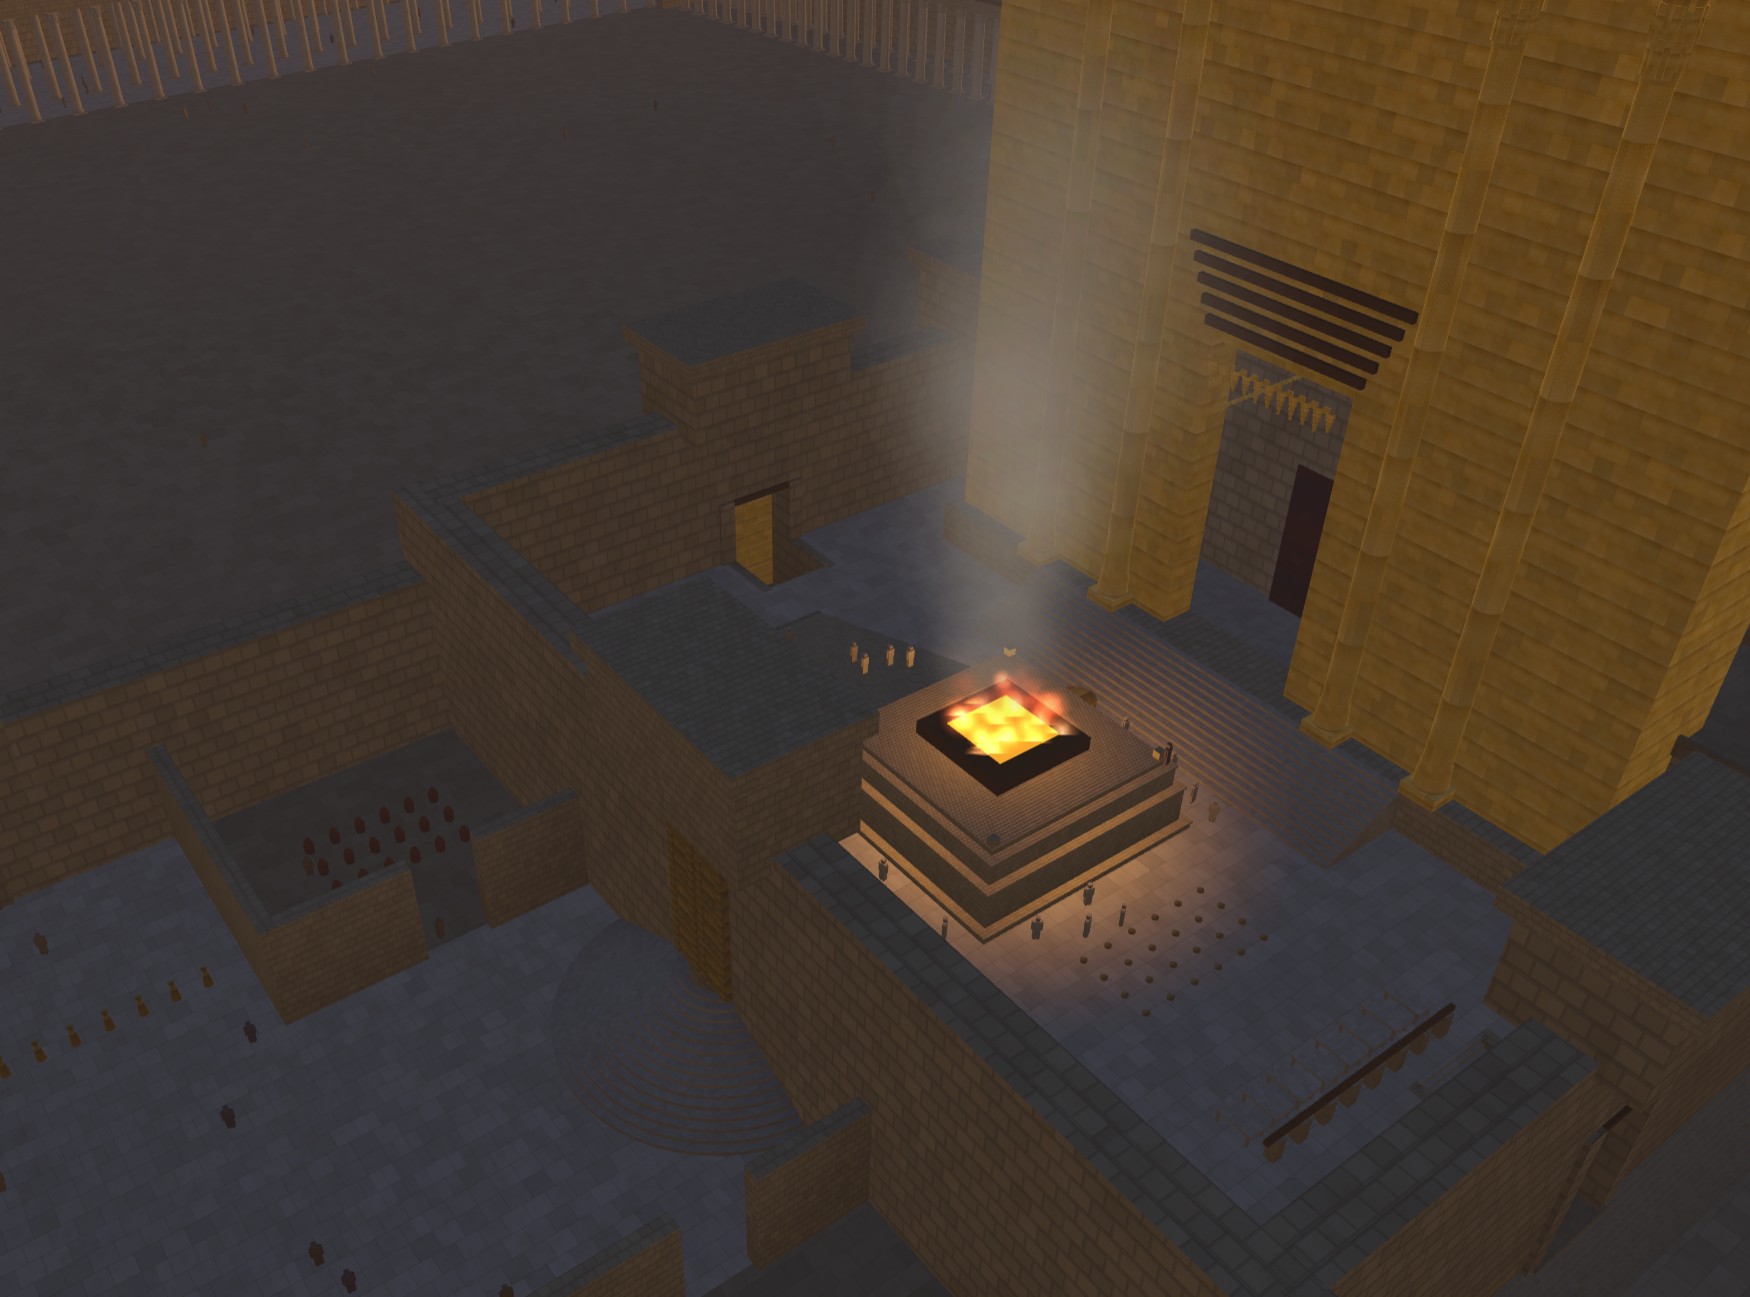
Below are some views of the Herod’s Temple model that compare the Blender version from today with the HTML version from July.
I also updated the code on Github and uploaded the model to Sketchfab so that you can use your own AI to make changes. Or maybe you have actual 3D-modeling skills and just want a starting place. In any case, feel free to use them however you want; AI-generated content isn’t copyrightable.
The Blender version is brighter and clearer, with better shadows and reflectivity.The HTML version is murkier.Again, the Blender version feels more realistic.I do like the fire in the HTML version better, though.
In the announcement for Opus 5, Anthropic demoed an interactive visualization of a car in a wind tunnel. Clearly the next logical question is: can Opus 5 build an interactive visualization of Herod’s Temple complex in Jerusalem during the time of Christ?
My prompt was simple, just asking it to build a historically accurate, interactive, 3D reconstruction of the Temple. It created the model and added the interactive tour elements itself. It took about twelve hours of computate time over 25 revisions to repair geometry and (my favorite) animate the fire/smoke effect. It came up on its own with the idea of letting you change the time of day. The code is well beyond my ability and desire to understand. My revisions were mostly variations on saying, “This looks wrong. Fix it,” which is how we debug in July 2026.
The model is probably wrong on some details, though Claude argued eloquently for why it was right and scholars were wrong (such as the orientation of the steps from the plaza into the Antonia Fortress in the northwest and the existence of a causeway across the Kidron). The beauty of using an LLM and open-sourcing the code is that you can just feed it new research papers as they’re published and ask it to apply the findings to the model.
It also includes views of New Testament events that happened at the Temple, together with verse references. Claude’s text is rife with its aggressively precise tone (“Every arch ring needs its spandrel”), and I didn’t review every word it wrote. It also enjoys narrating its whole journey of discovery in code comments.
Some views:
A morning view from the east captures the gold reflection in the morning sun.The central Temple area.The glow from the altar in the evening shows off the lighting.
In 1925, Gustaf Dalman collected 100 (actually 101) photos taken by the German Air Force in 1917 and 1918 into the book One Hundred German Aerial Photographs of Palestine. In addition to the photos, he also described what they depicted, and he cataloged the locations of over 1,200 similar photos taken around the same time.
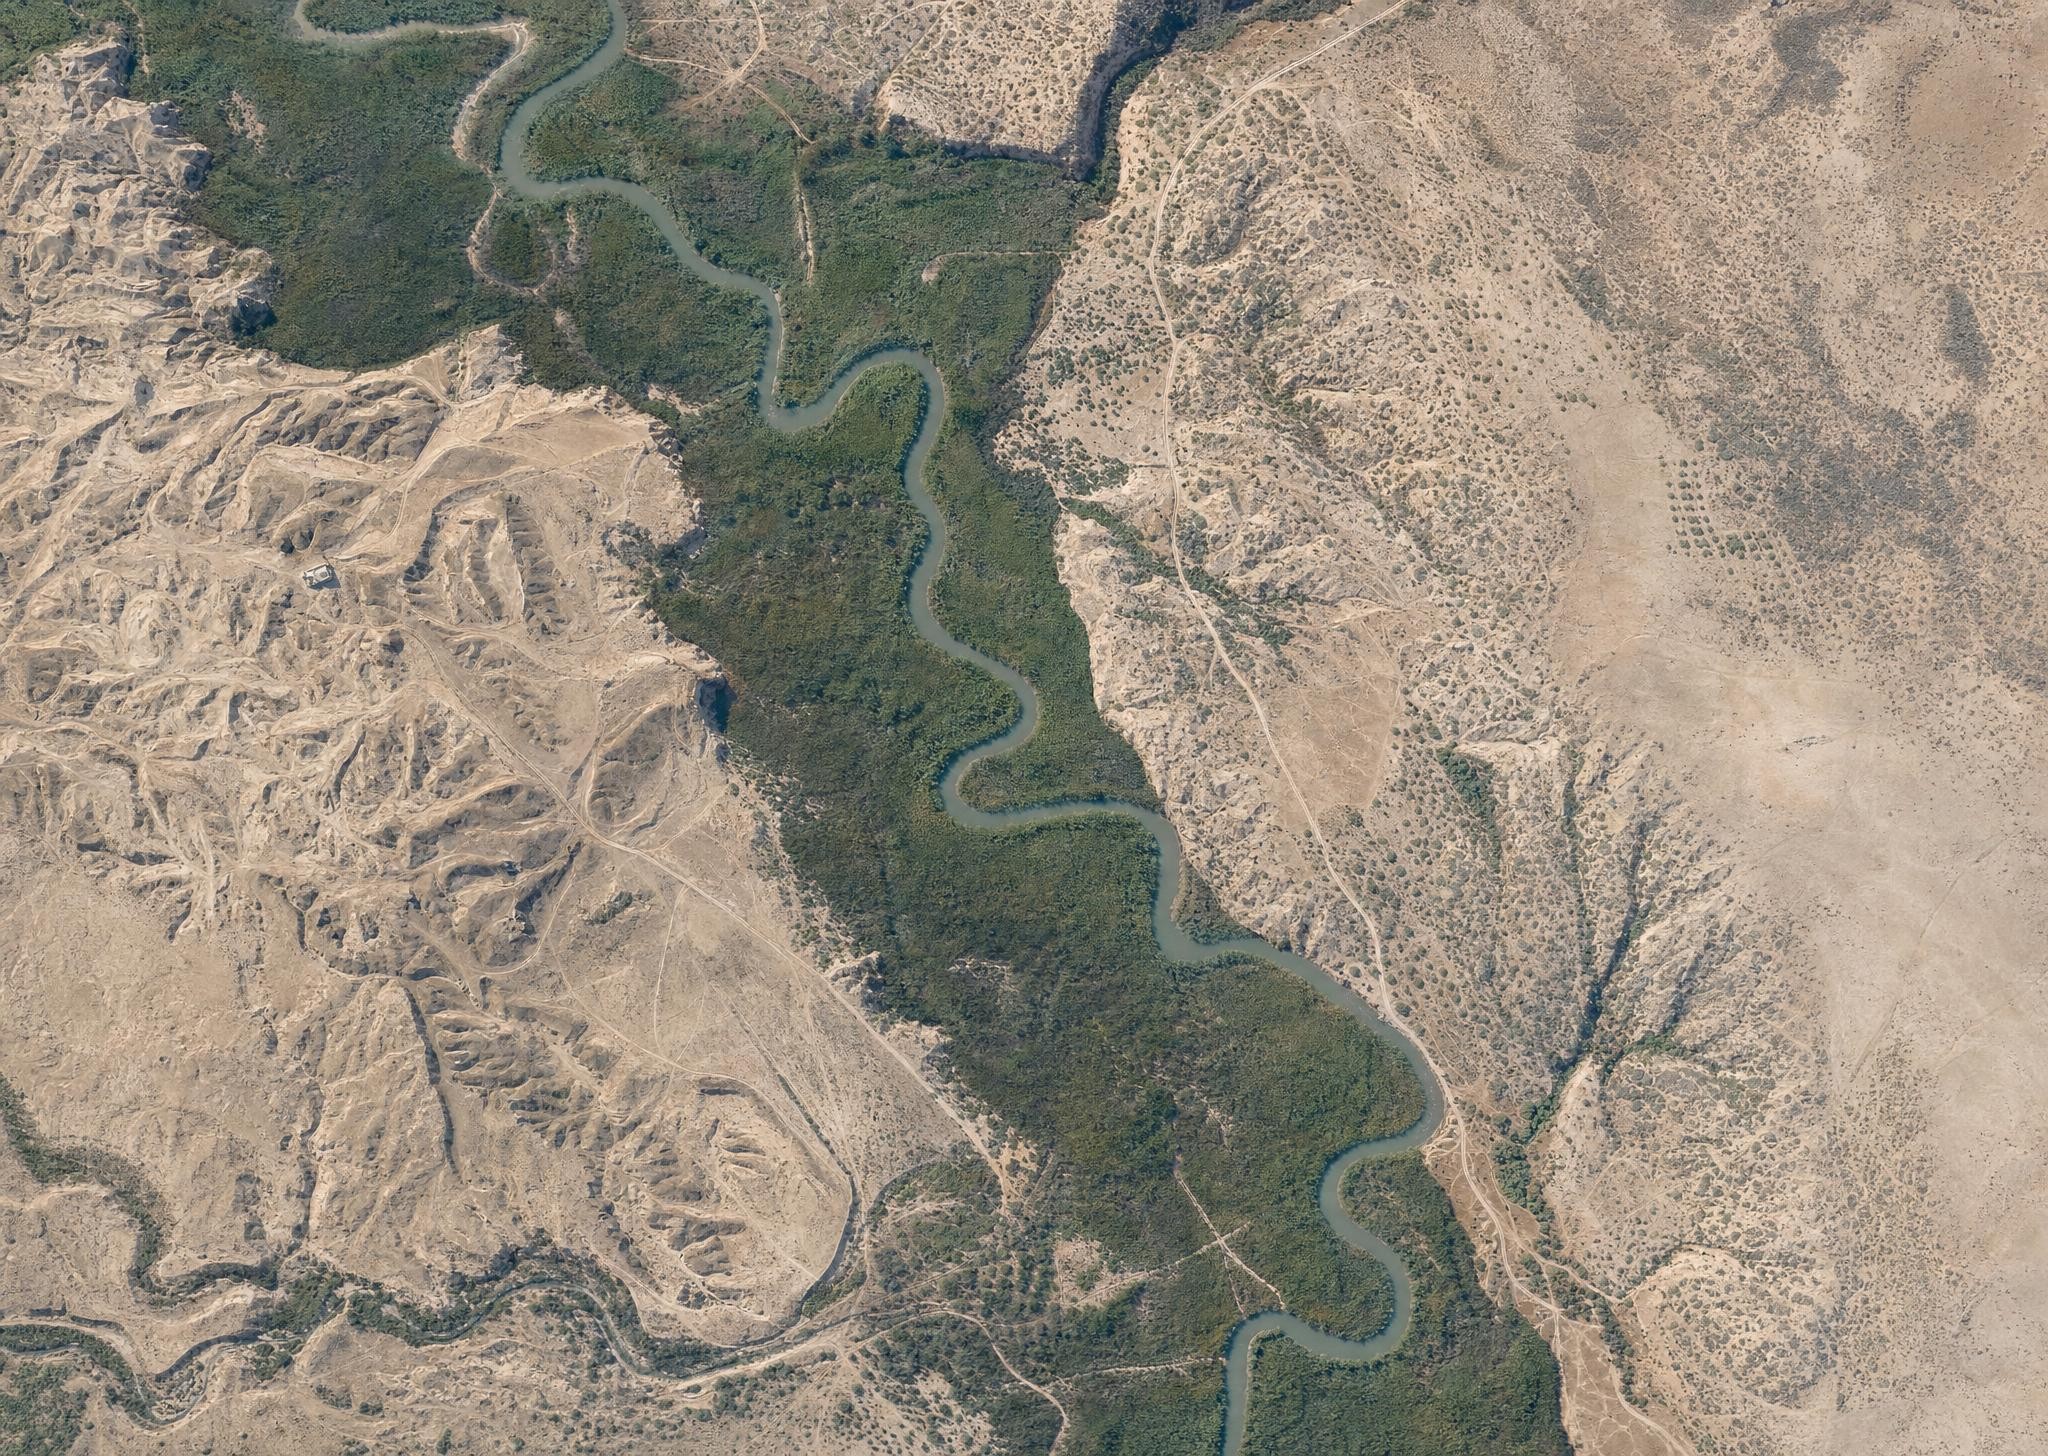
First, AI can colorize the photos. Below is what AI imagines the Jordan River looked like in March 1918, based on a historical photo. Compare it with a modern view of the same area, and you see much less vegetation across today’s Jordan Valley, with natural growth confined to a narrow strip around the Jordan’s watercourse. This kind of historical view gives you a better sense of what the area looked like in biblical times, assuming you were a bird. (The AI is also inventing sloppy details, so it’s creating immediacy at the expense of accuracy.) My instruction to the AI (GPT-Image-2) was to make each image look like it was taken with a modern iPhone.
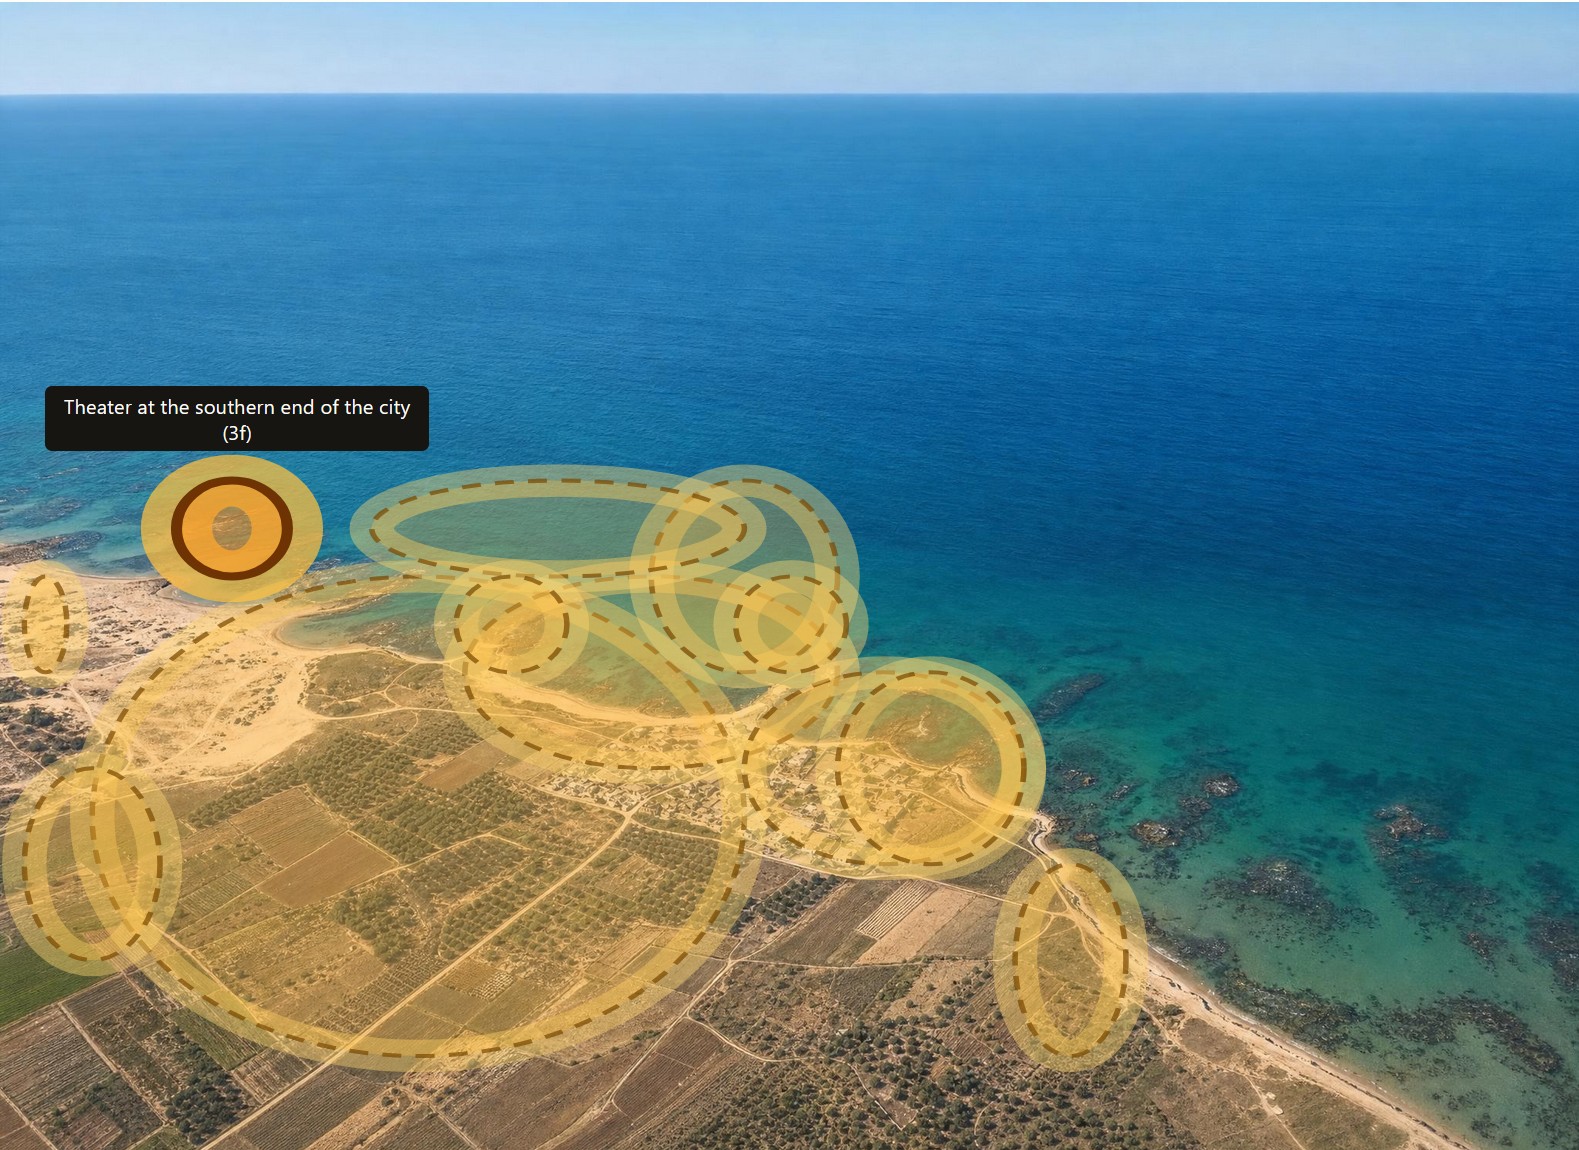
Second, AI can highlight all the features that Dalman mentions in his text. Below is Caesarea with all his annotations highlighted. Excavations at Caesarea wouldn’t happen until the 1950s, so you’re seeing the fishing village that it was at the time.
In the online book, you can click on any of the images to see the original black-and-white photos instead of the colorized AI images, if that’s how you want to roll.
Third, AI can translate the whole book from German into English. I don’t have a snappy image for you here, but it did a much better job than I would have.
Fourth, AI parsed the catalog at the end of the book so that it links to all the original photos at the Bavarian State Archives.
All the data and images for this book are in the public domain (at least in the United States), and the AI-generated images aren’t copyrightable, so you can enjoy and remix as you like. For the sake of clarity, I’m releasing the book under a CC0 license.
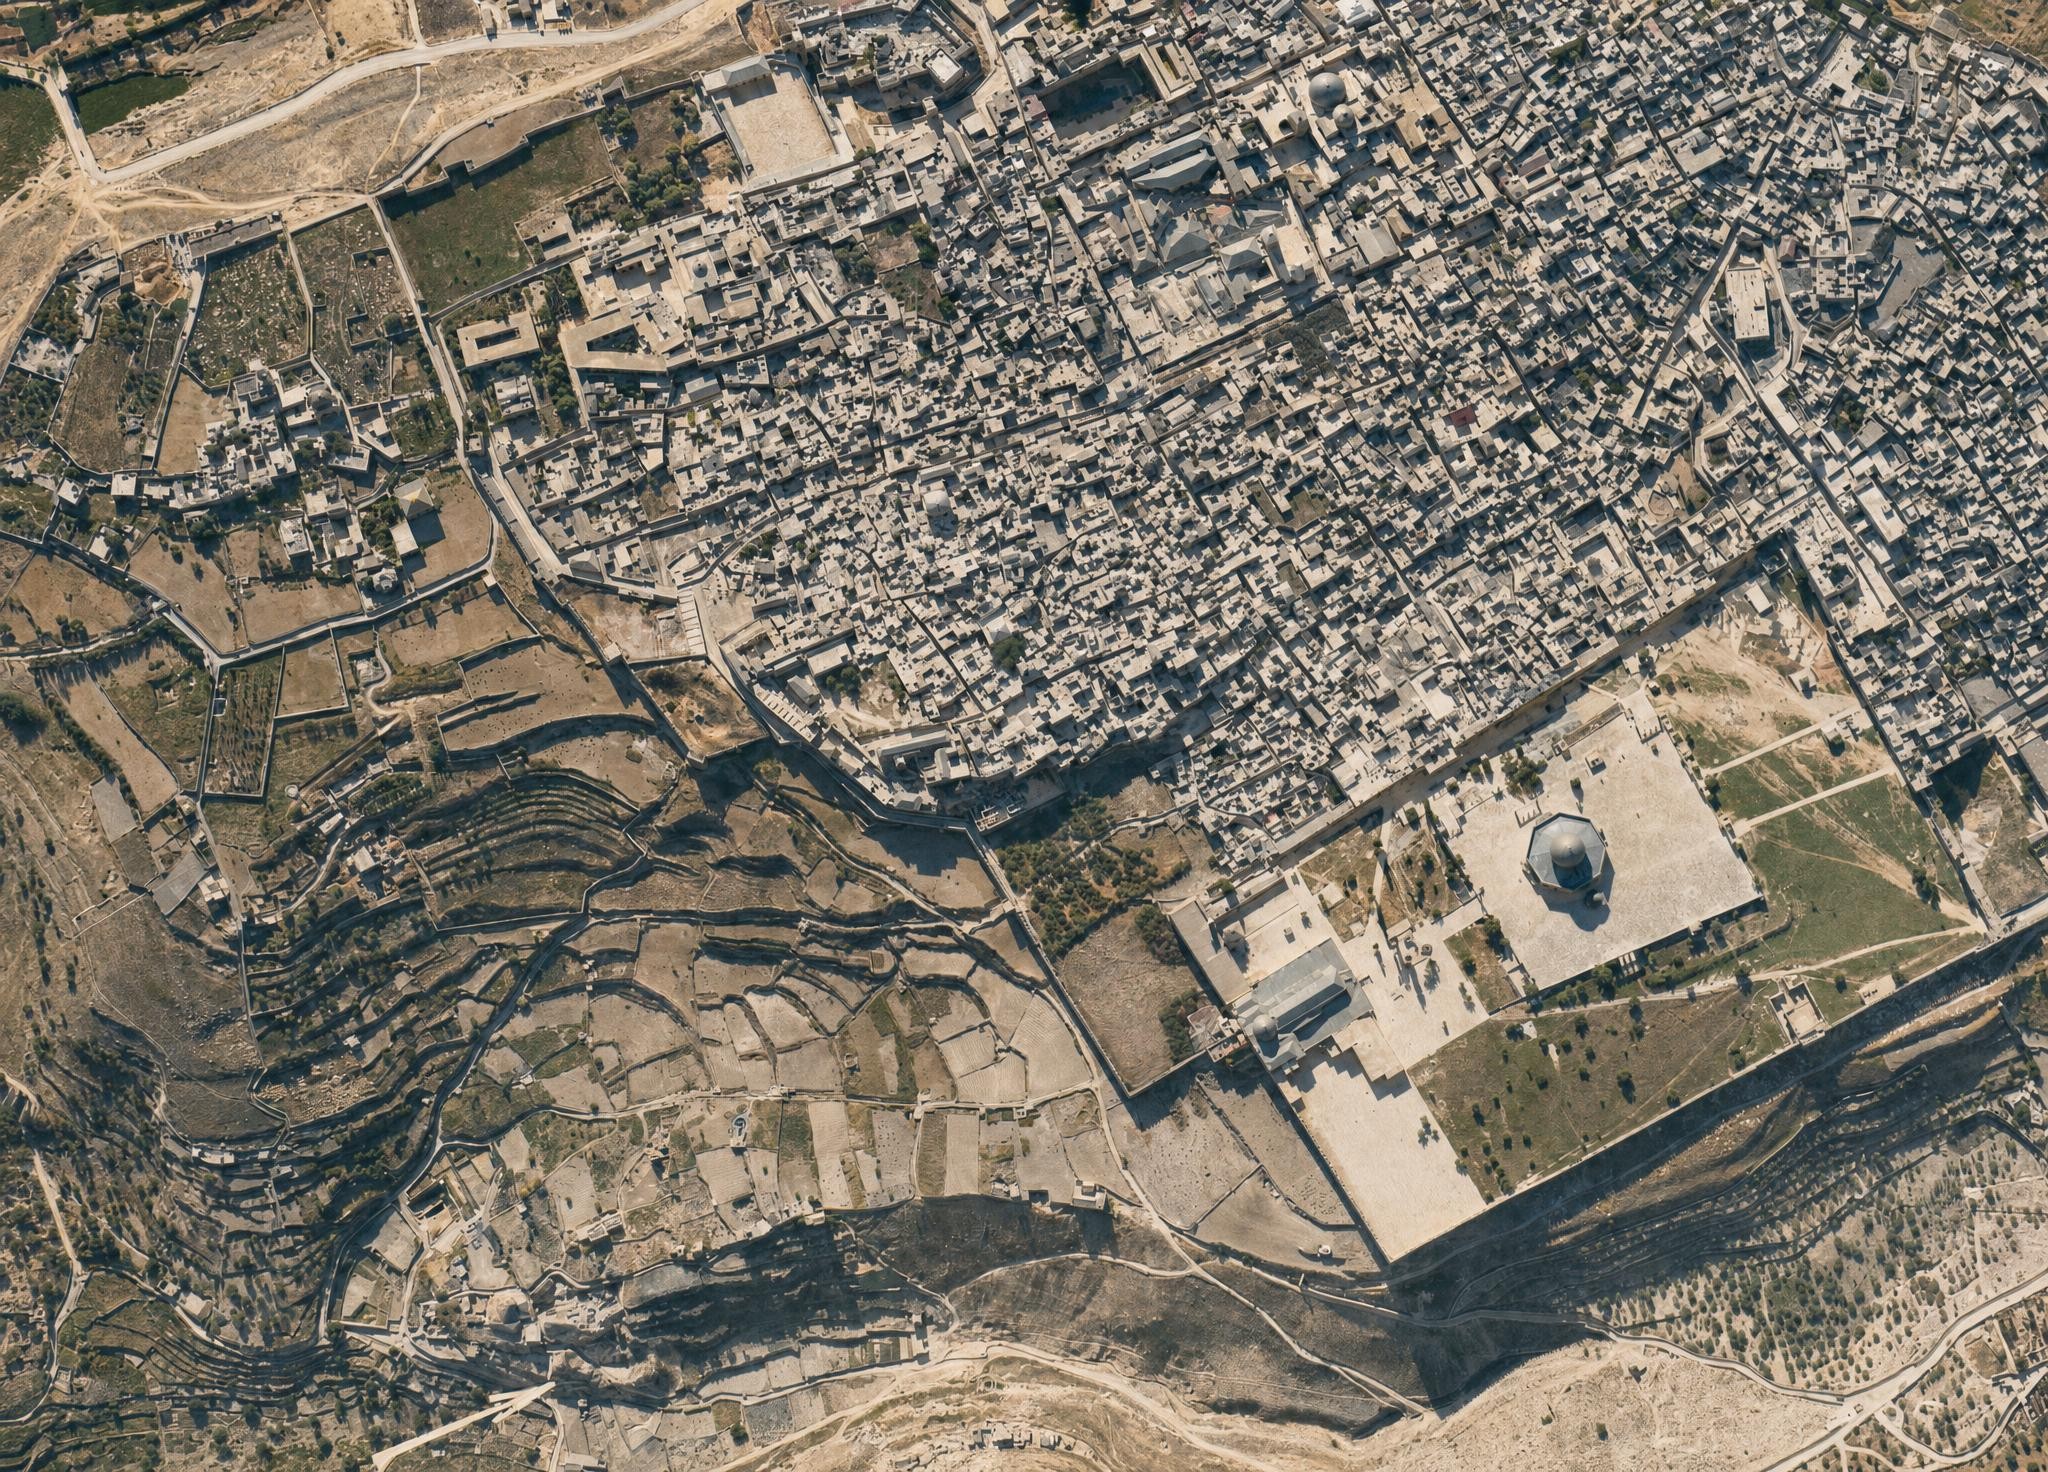
I leave you with this view of the Jerusalem’s Old City, which, again, shows much more open space than a modern view. I did have to keep reminding the AI that the Dome of the Rock didn’t have a golden dome at the time. The topography of the City of David (to the left of the Temple Mount) is clearly visible.
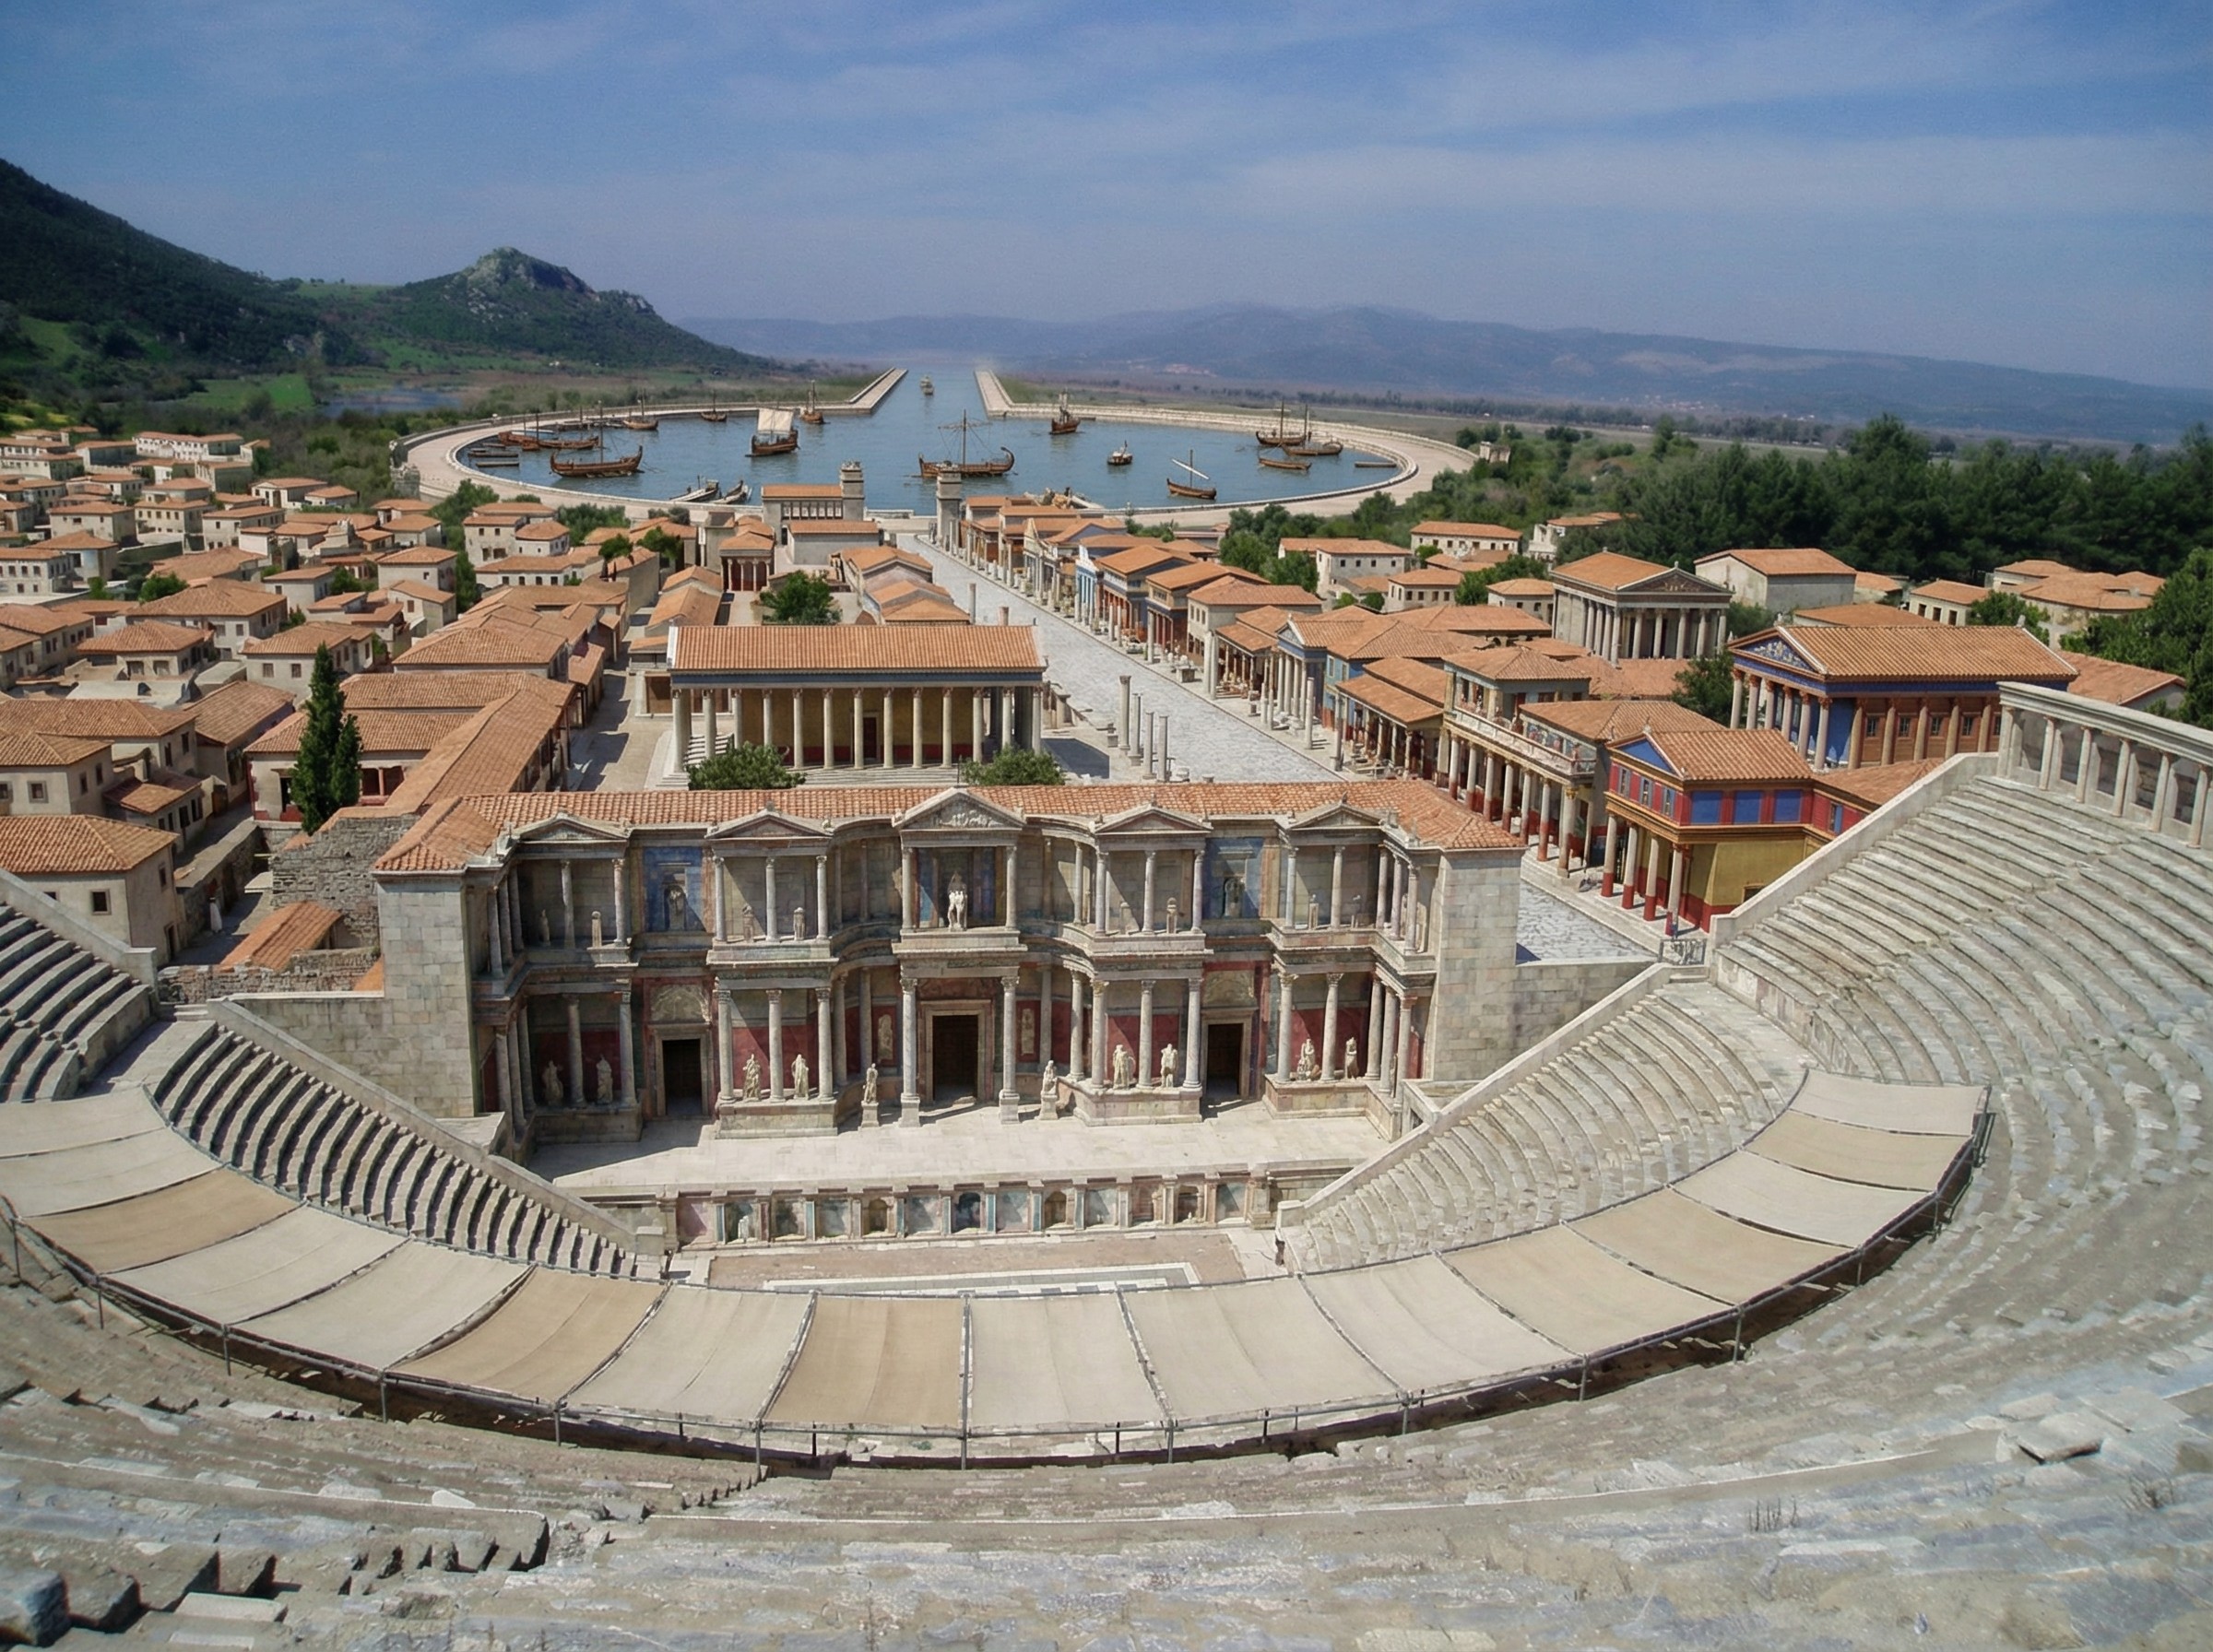
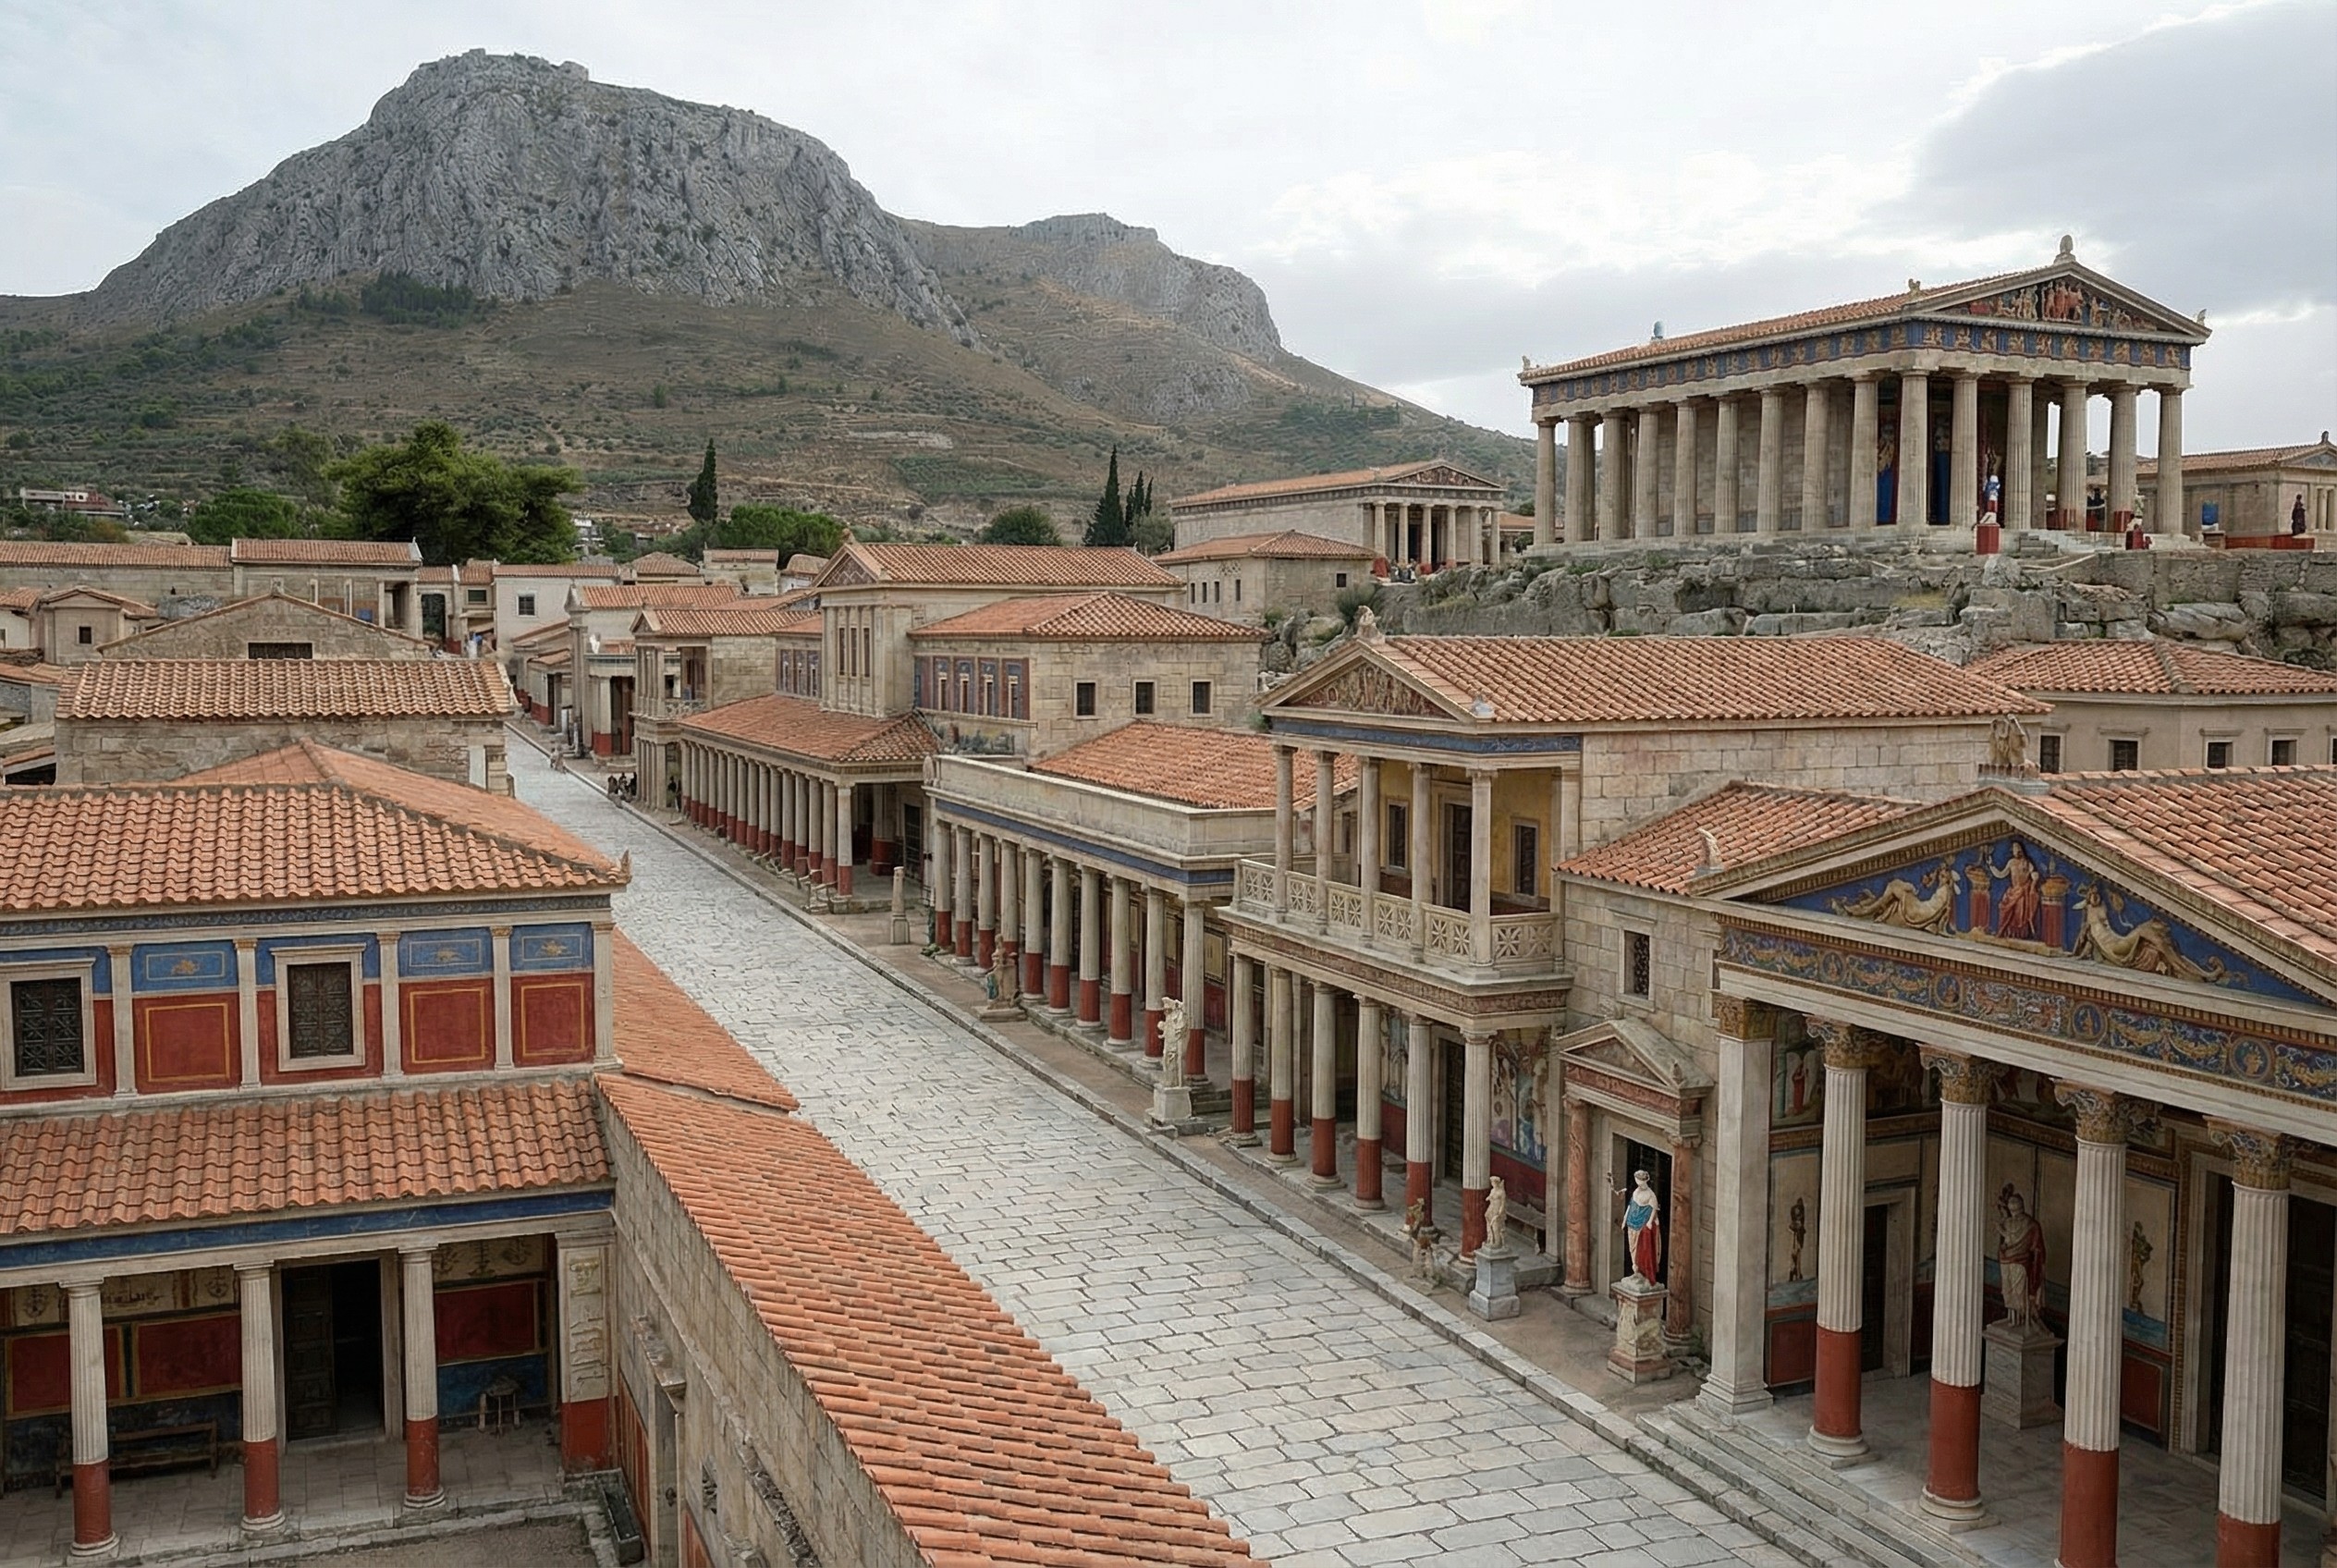
Nano Banana Pro does a plausible job of turning a real photo of an archaeological site into what the photo might have looked like if you’d taken it from the same vantage point thousands of years ago. You can imagine an app running on your future phone that lets you turn your selfies at historical sites into realtime, full-blown reconstructions (complete with changing your clothes to be historically appropriate).
Here’s a reconstructed view of Ephesus (adapted from this photo by Jordan Klein). I prompted it to add the harbor in the distance, which no longer exists in the modern photo.
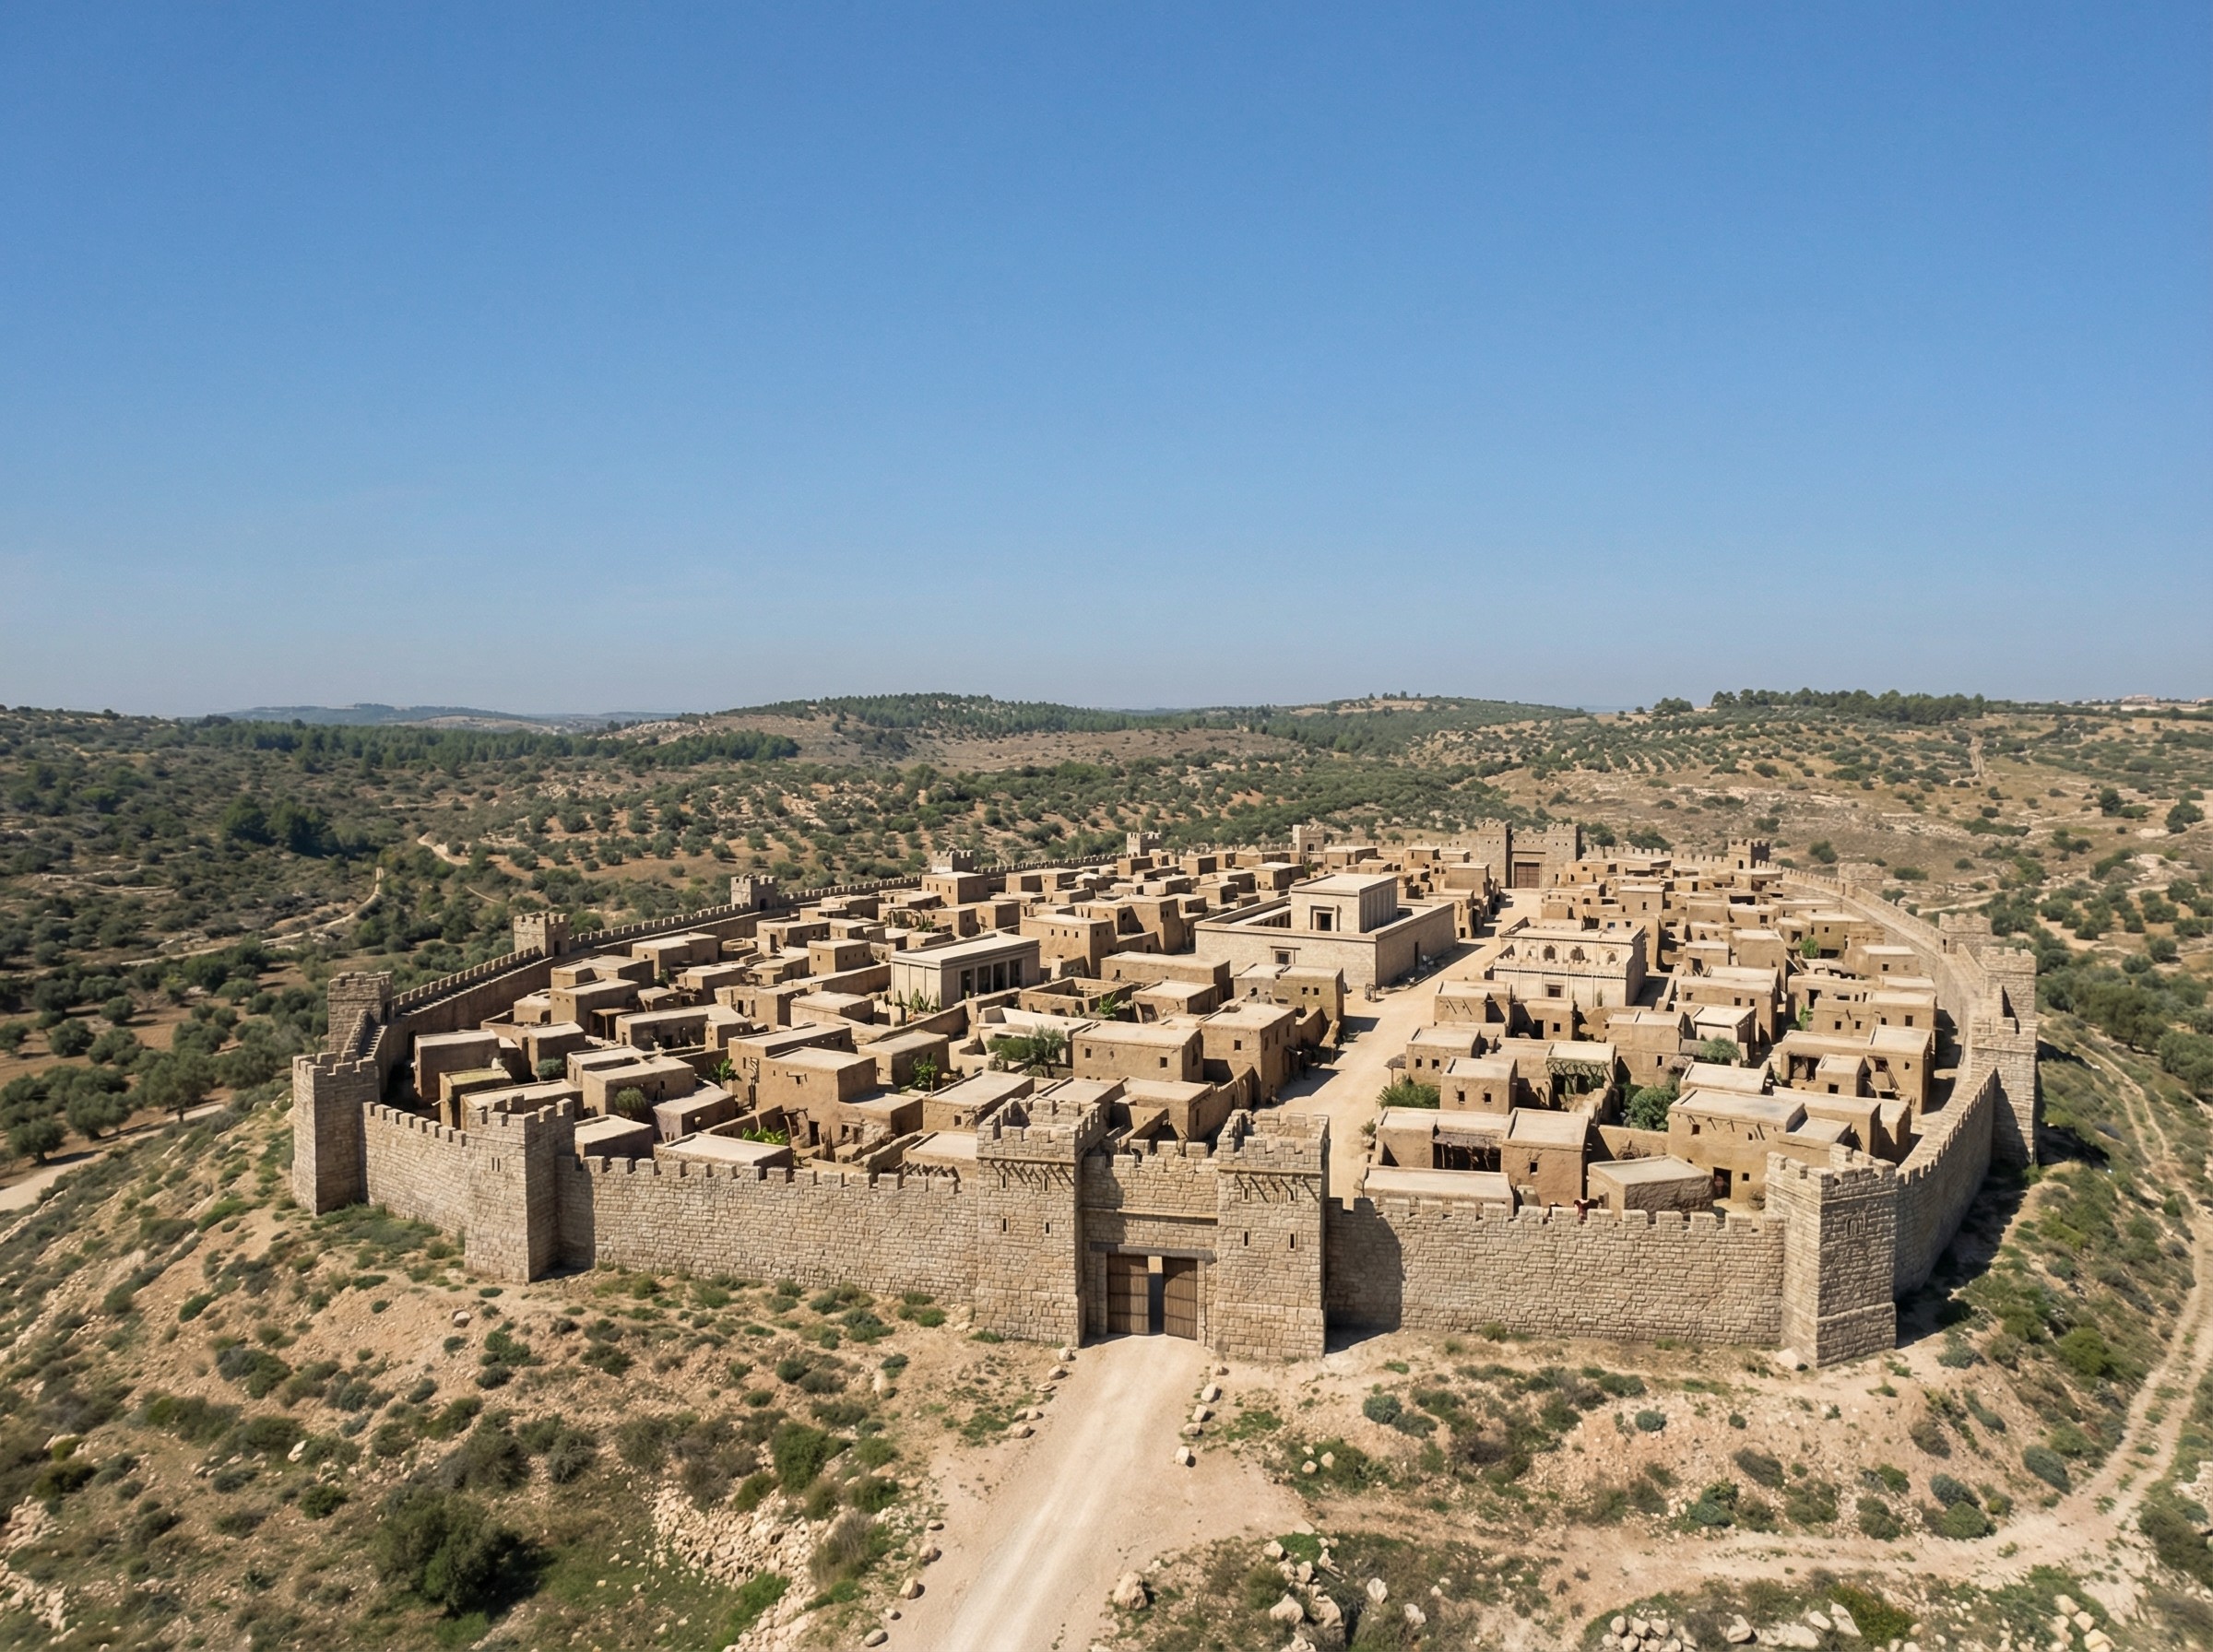
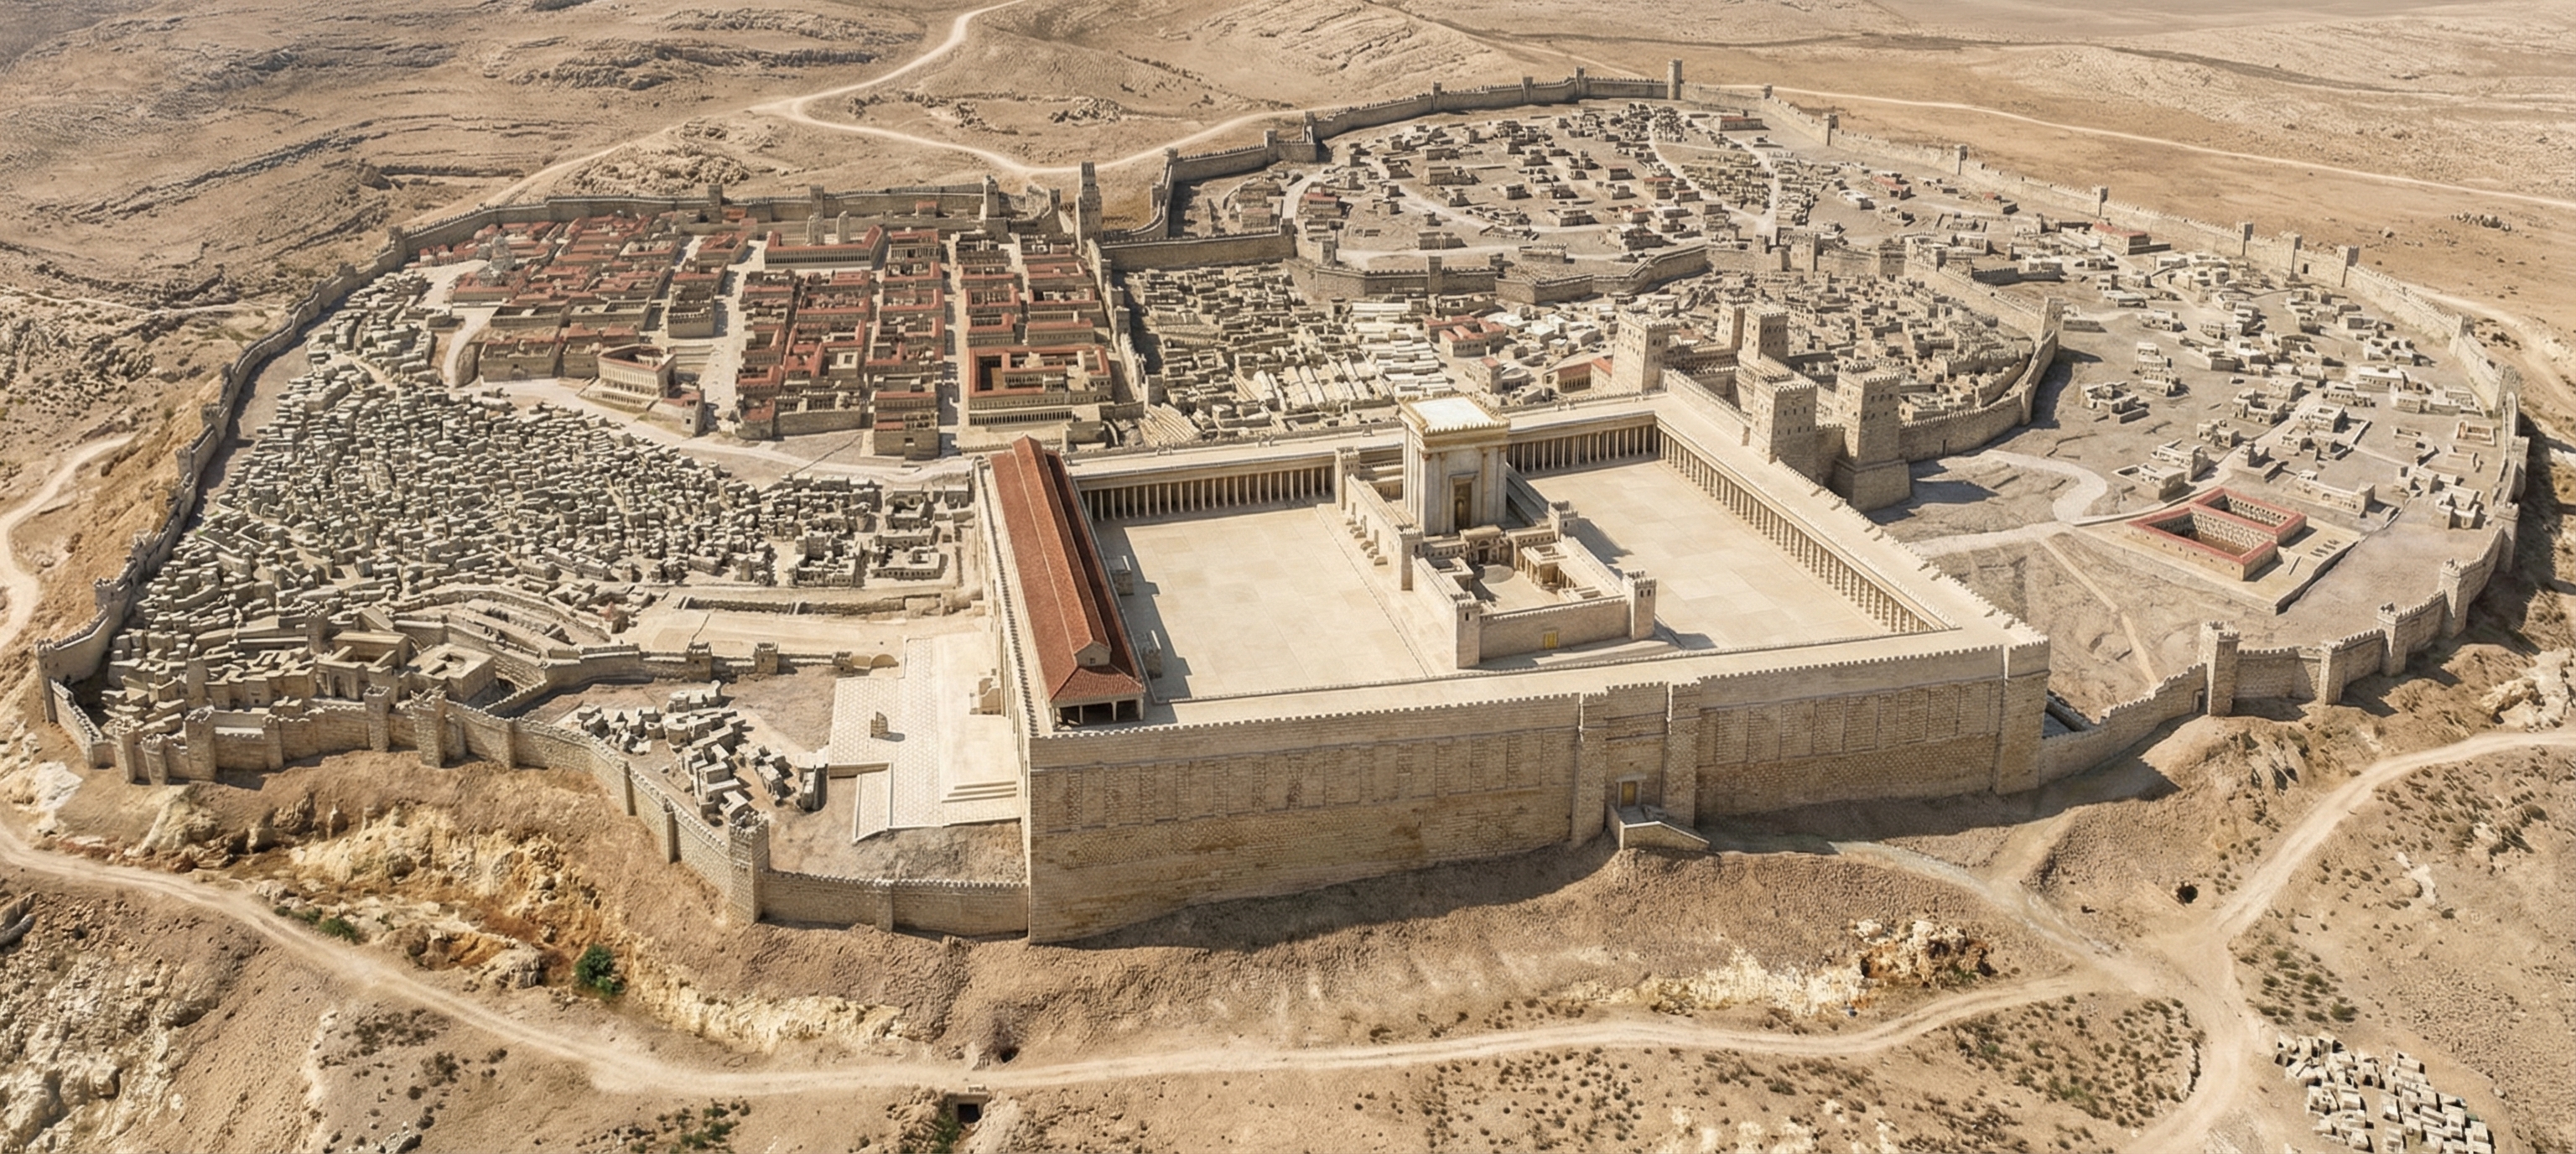
Google this week launched Nano Banana Pro, their latest text-to-image model. It far outshines other image generators when it comes to historical recreations. For example, here’s a reconstruction of ancient Jerusalem, circa AD 70:
I gave it this photo of the Holyland Model in Jerusalem and told it to situate in its historical, geographical context. Some of the topography isn’t quite right, but it’s pulling much of that incorrect topography from the original model. It can also make a lovely sketched version.
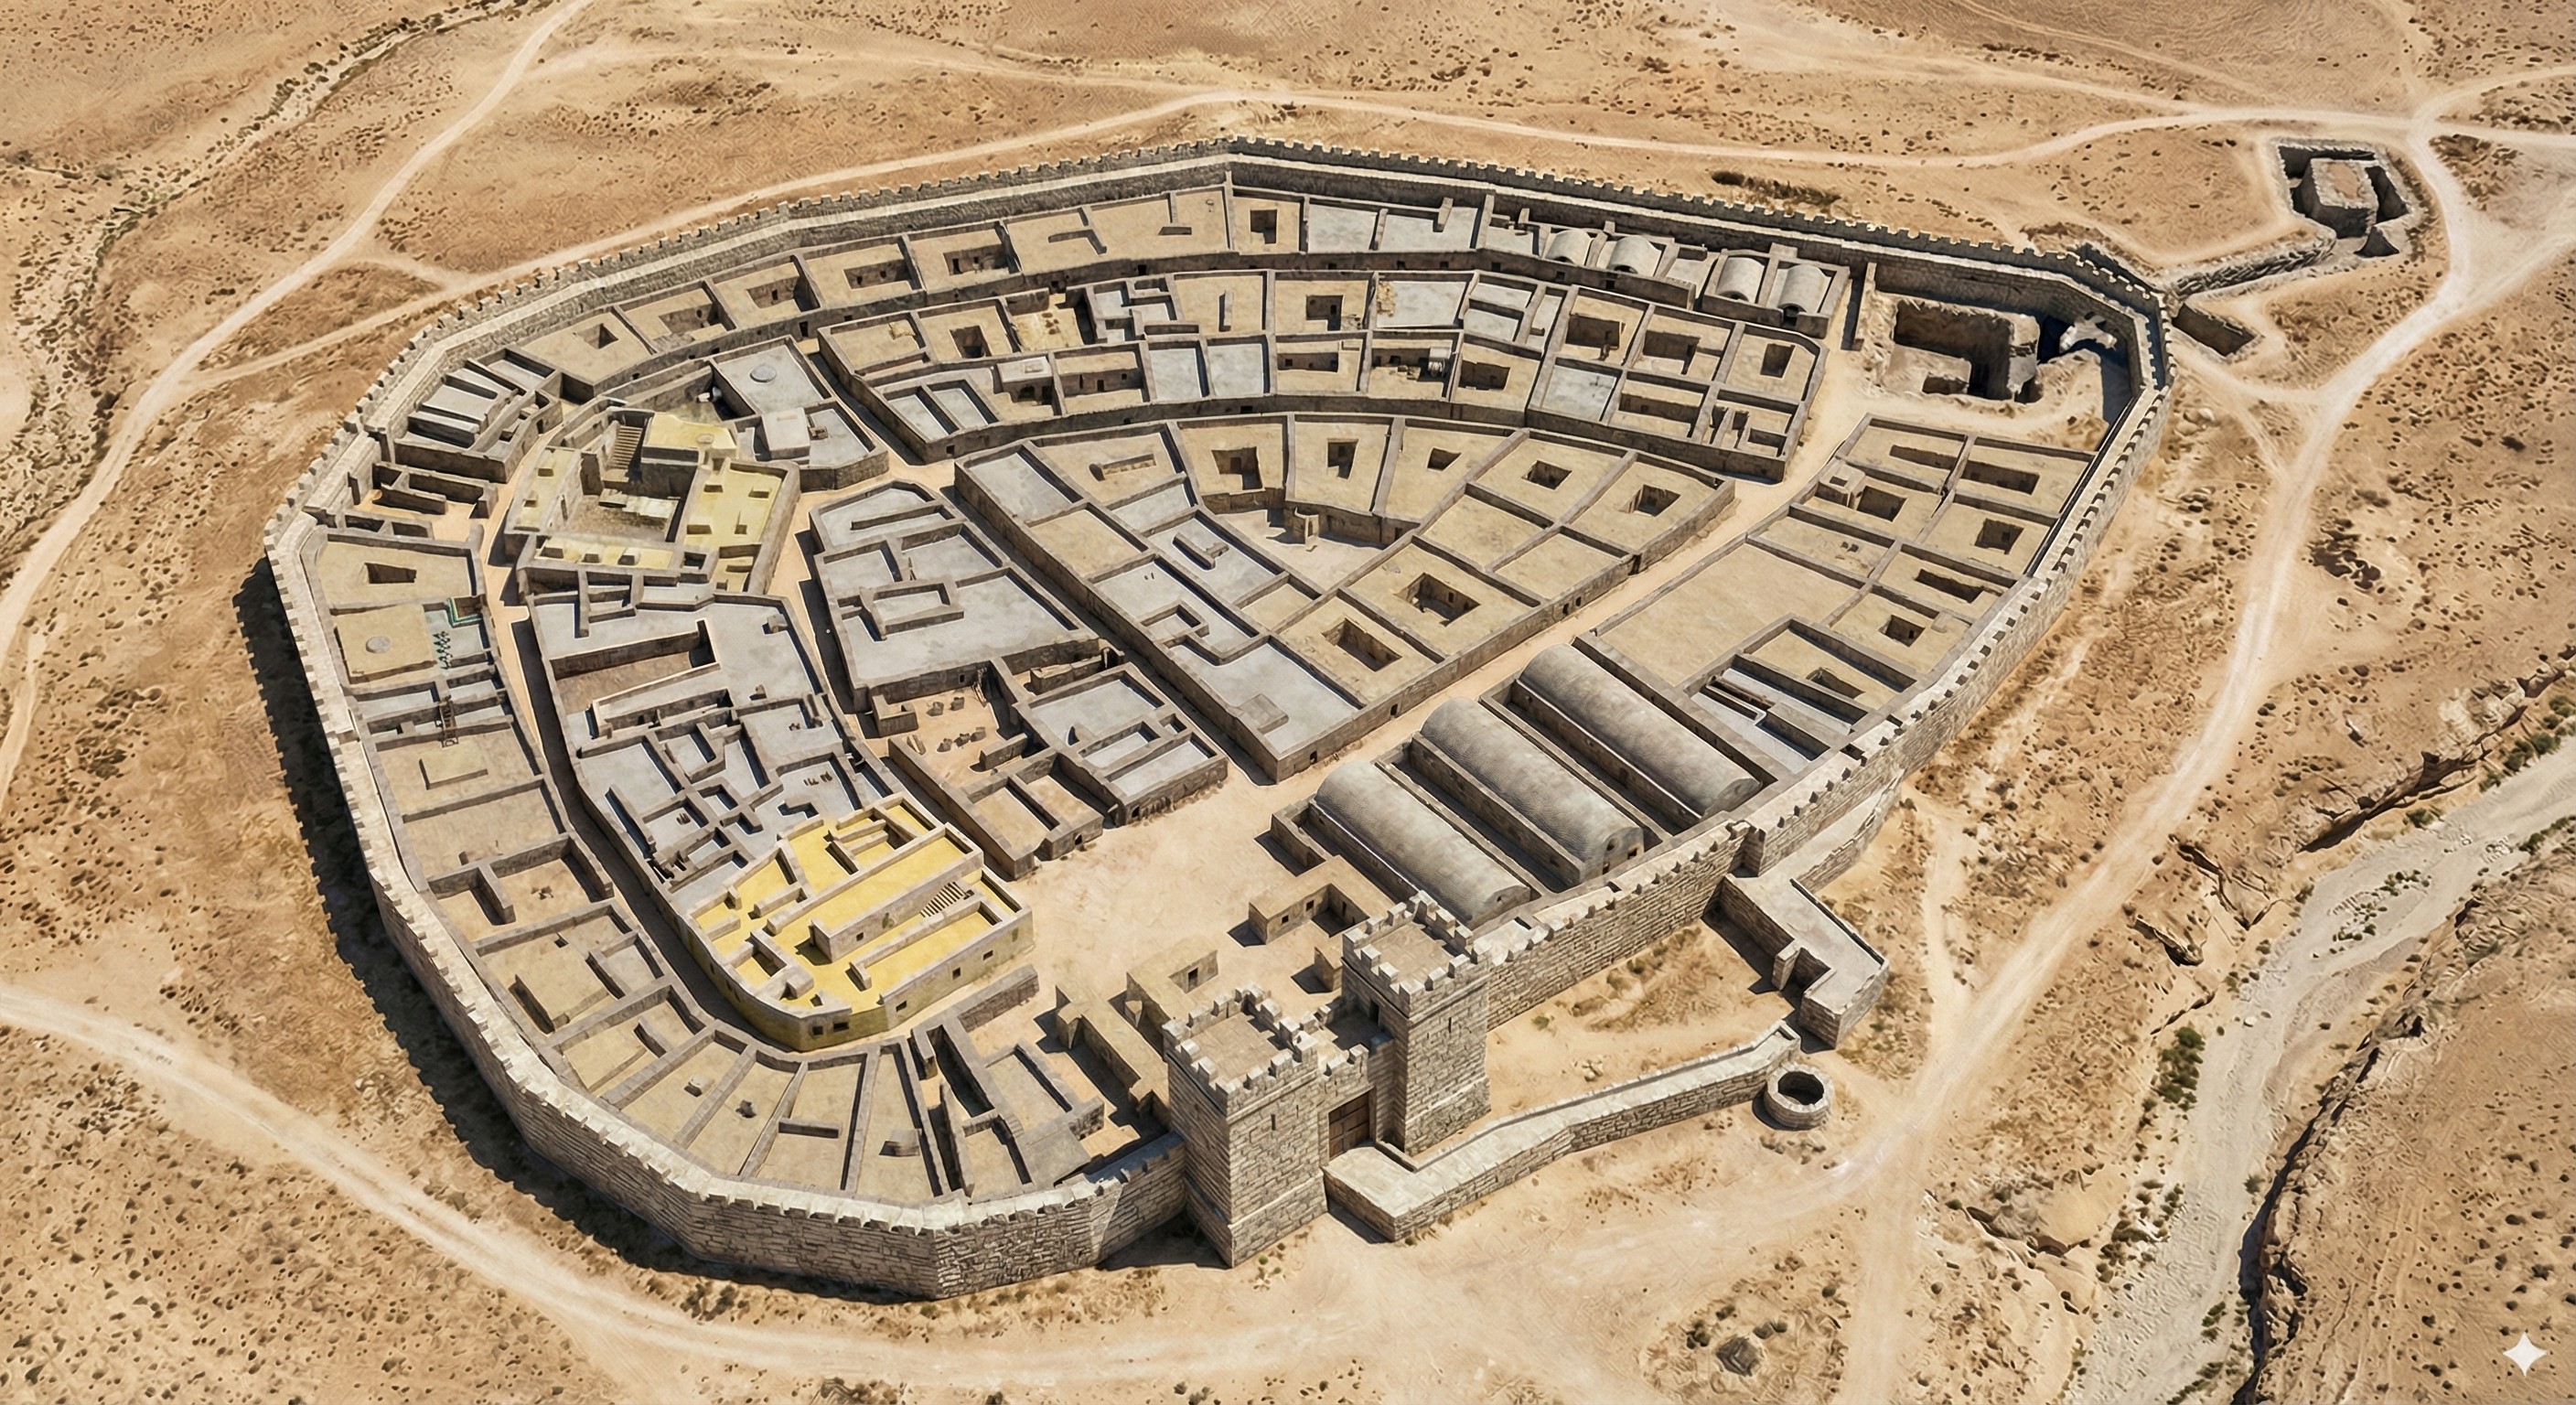
It also does Beersheba. Here I gave it a city plan and asked it to create a drone view. The result is very close to the plan; my favorite part is the gate structure and well.
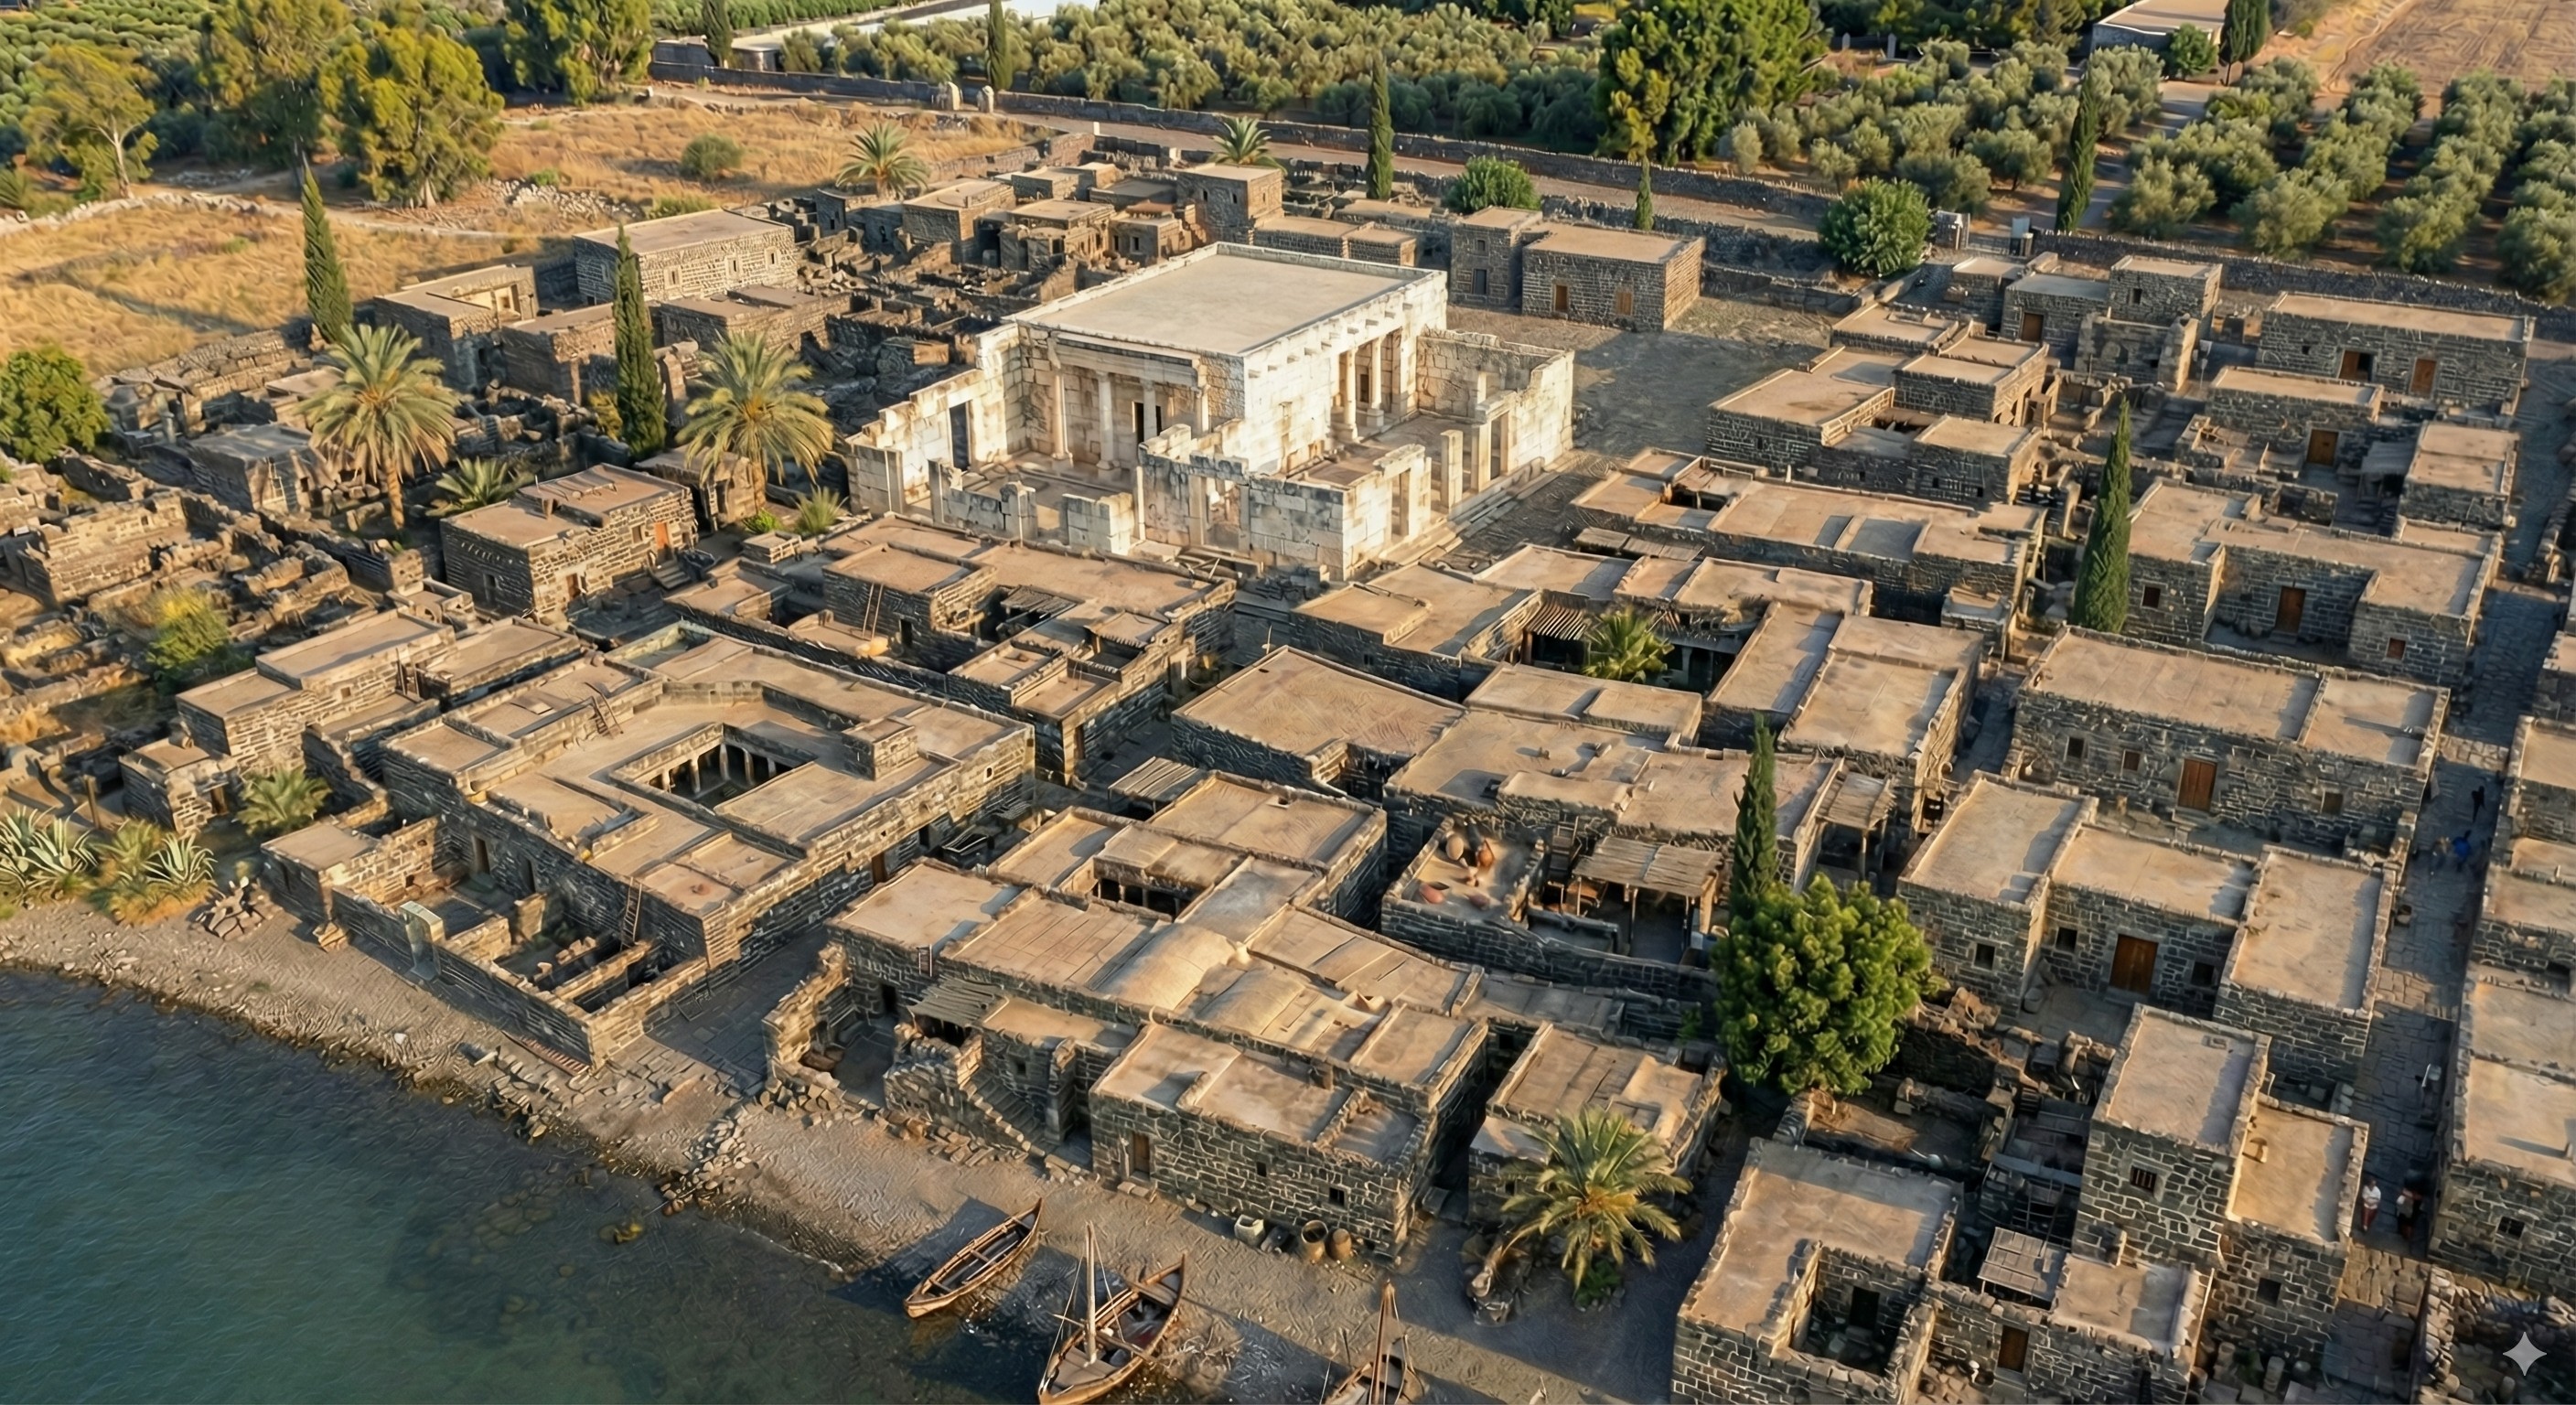
It was somewhat less-successful with Capernaum (below). I gave it a city plan and this photo of the existing ruins. It’s kind of close, though it doesn’t exactly match the plan. It’s almost a form of archaeological impressionism, where the image gives off the right vibes but isn’t precisely accurate. Also try a 3D reconstruction of this image using Marble from World Labs.
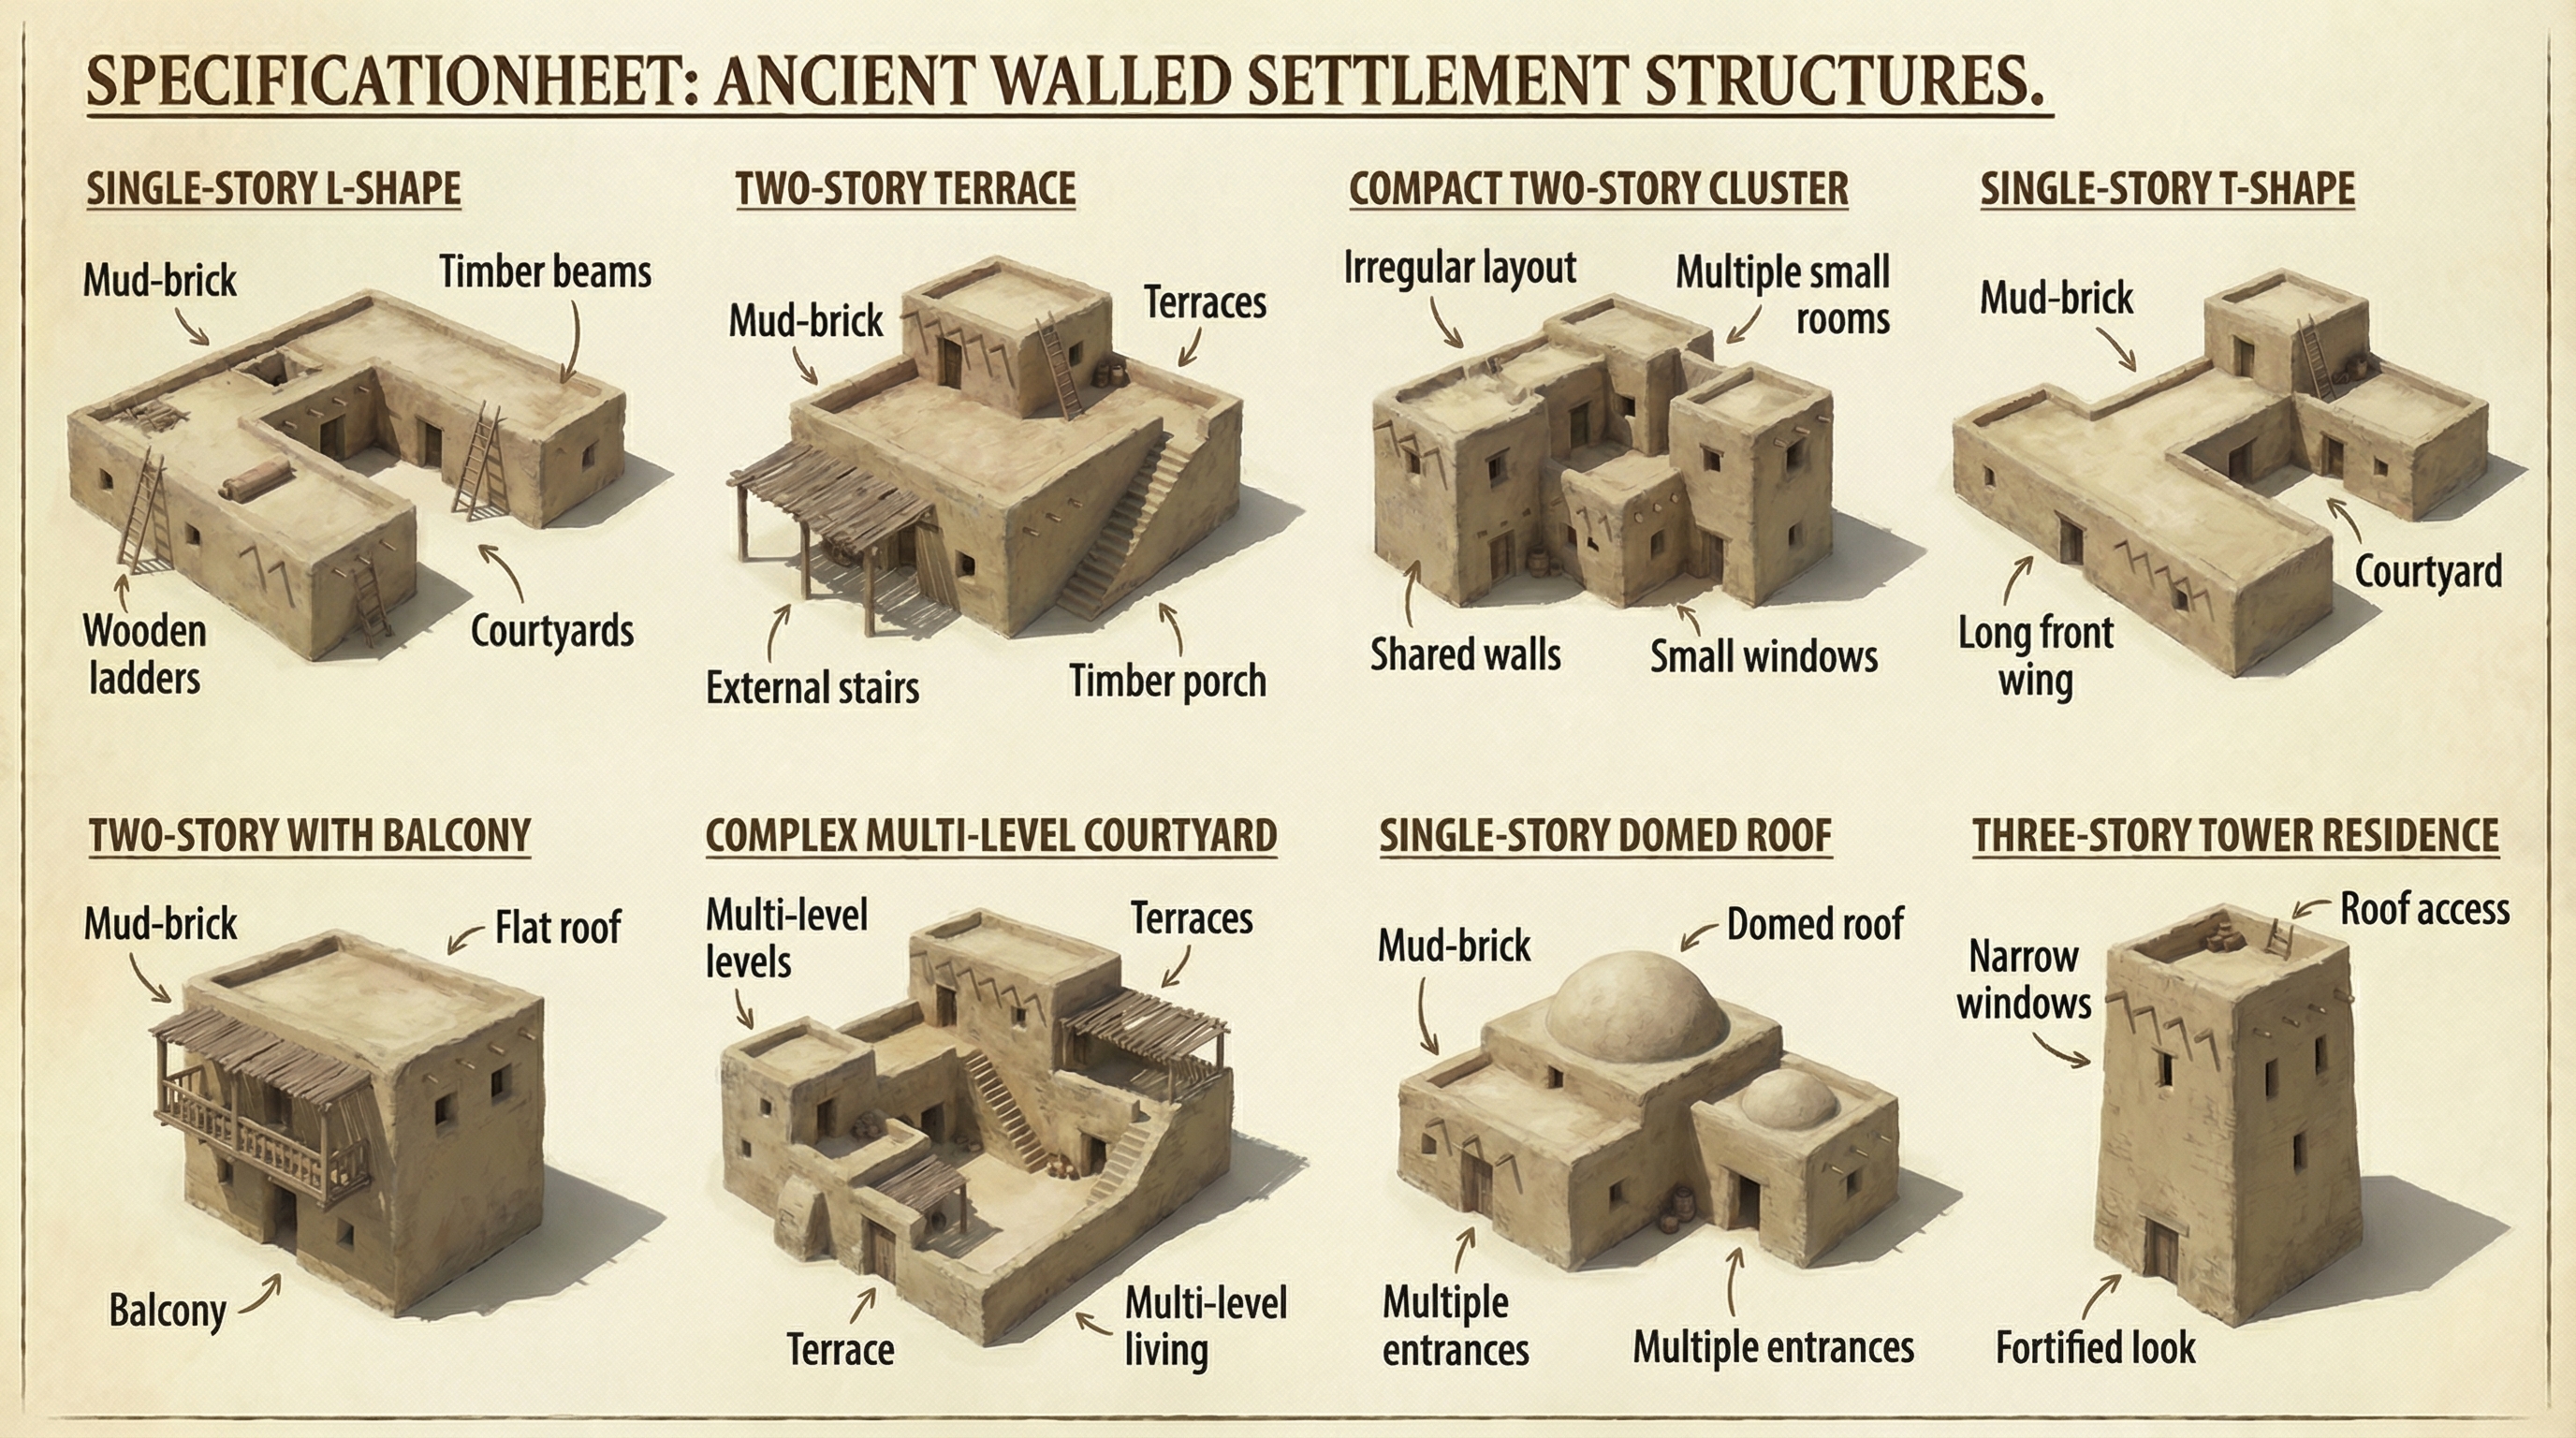
Finally, I had it create assets that it could reuse for other cities for a consistent look:
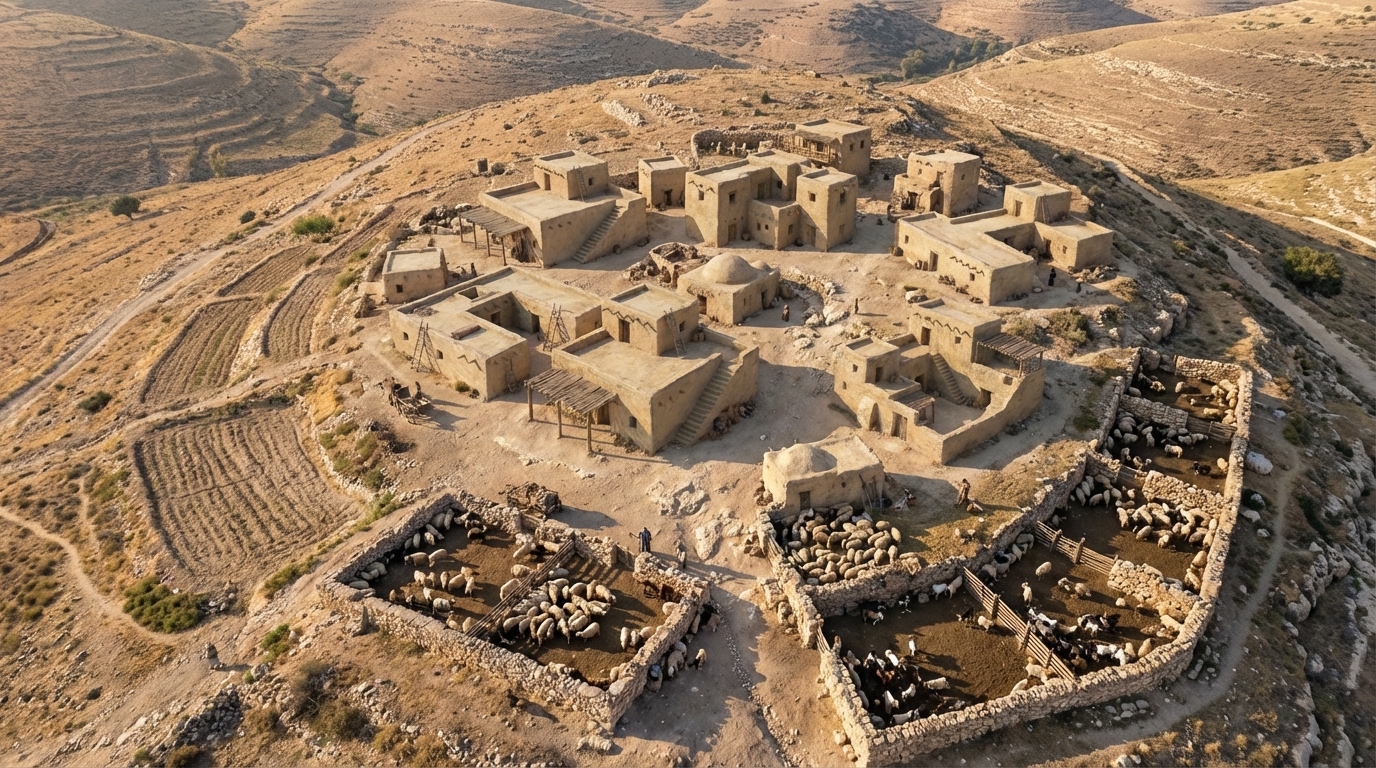
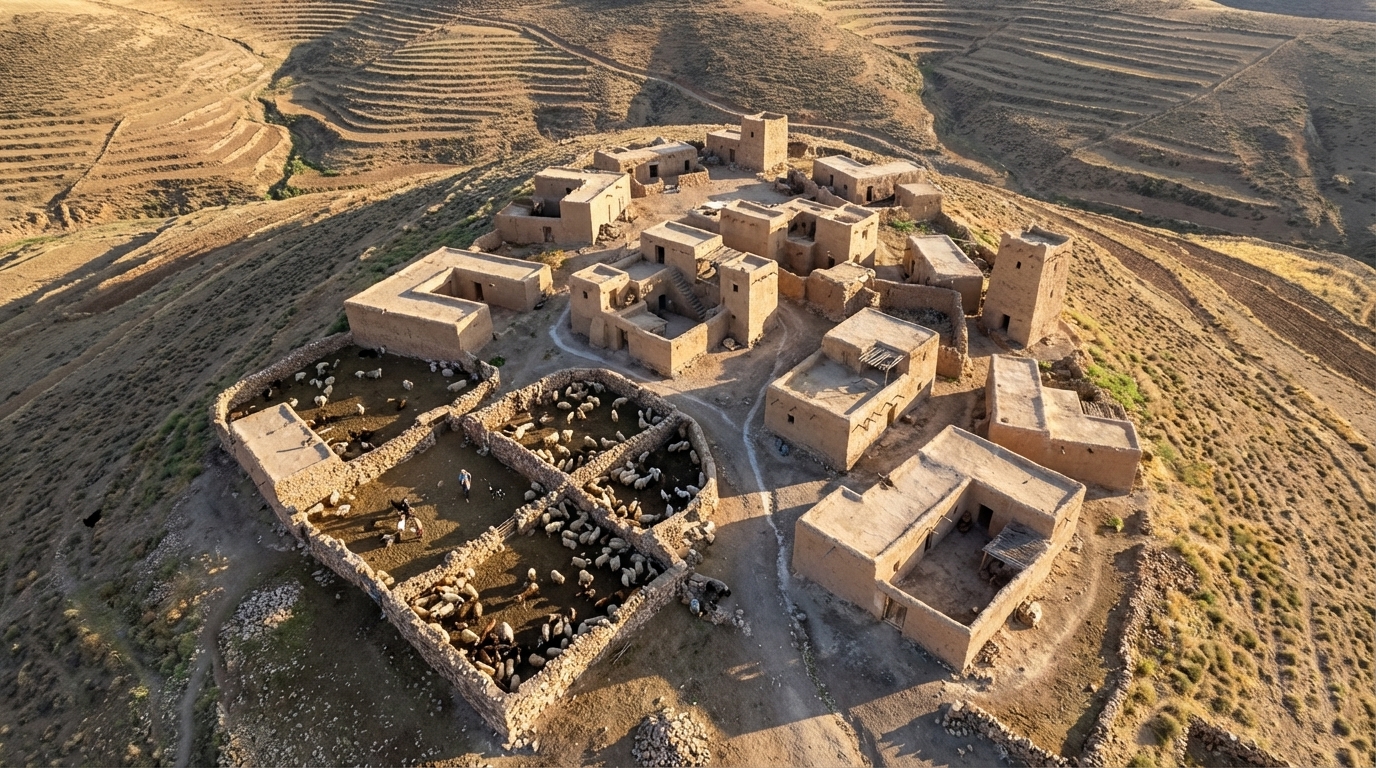
I then had it create a couple typical hilltop shepherding settlements using the assets it created (again using “drone view” in the prompt):
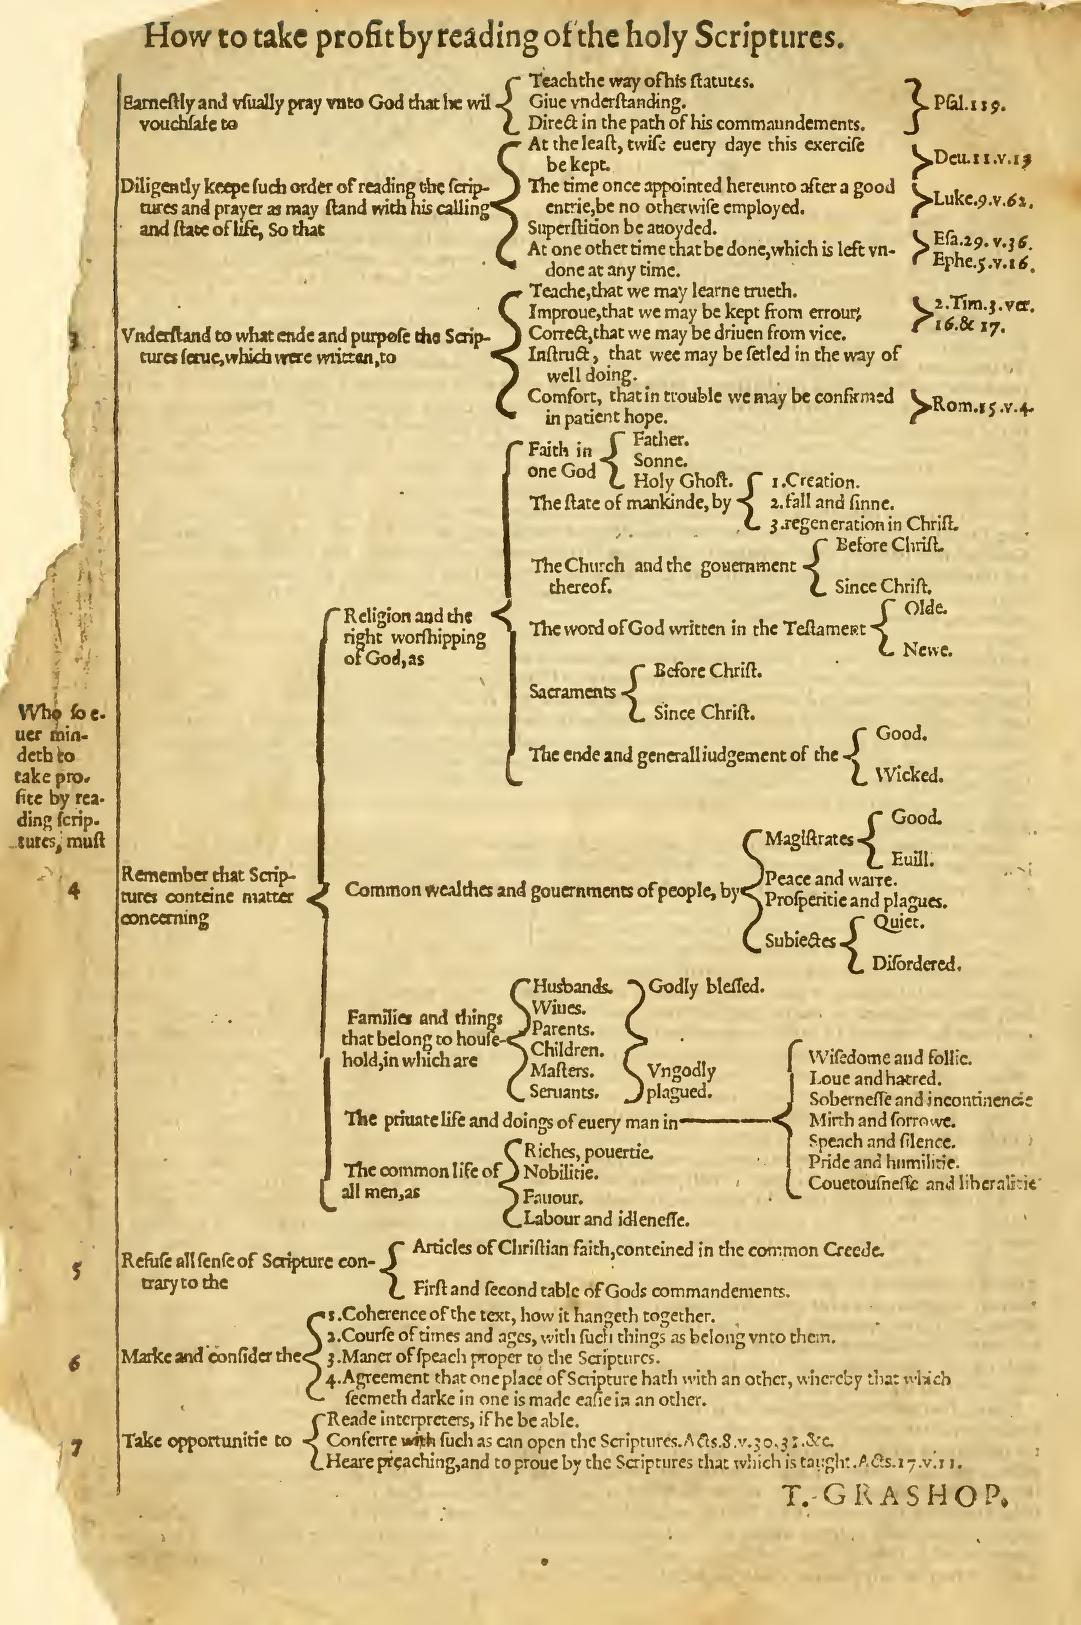
Many printings of the Geneva Bible after 1579 contain the following flowchart by T. Grashop. This flowchart reflects the Renaissance obsession with ordering the world using tree diagrams and presents a systematic approach to studying the Bible. I share it here to show that “mind-mapping” Bible study isn’t a new idea; it has extensive historical roots.
Below is a reproduction I created with modernized spelling and design. I particularly want to note the reference to Isaiah 29:36 in this chart. This verse doesn’t exist. If anyone knows what verse Grashop might have meant, especially as it relates to “Superstition be avoided” when studying the Bible, I’d be interested in correcting this 400-year-old typo. Sean Boisen in the comments presents a plausible case that it should be Isaiah 2:6.