Blog / Twitter

The Bible on Twitter in 2014

Bible Gateway recently shared their most-popular Bible verses of 2014, and I wanted to discuss this chart a little more:
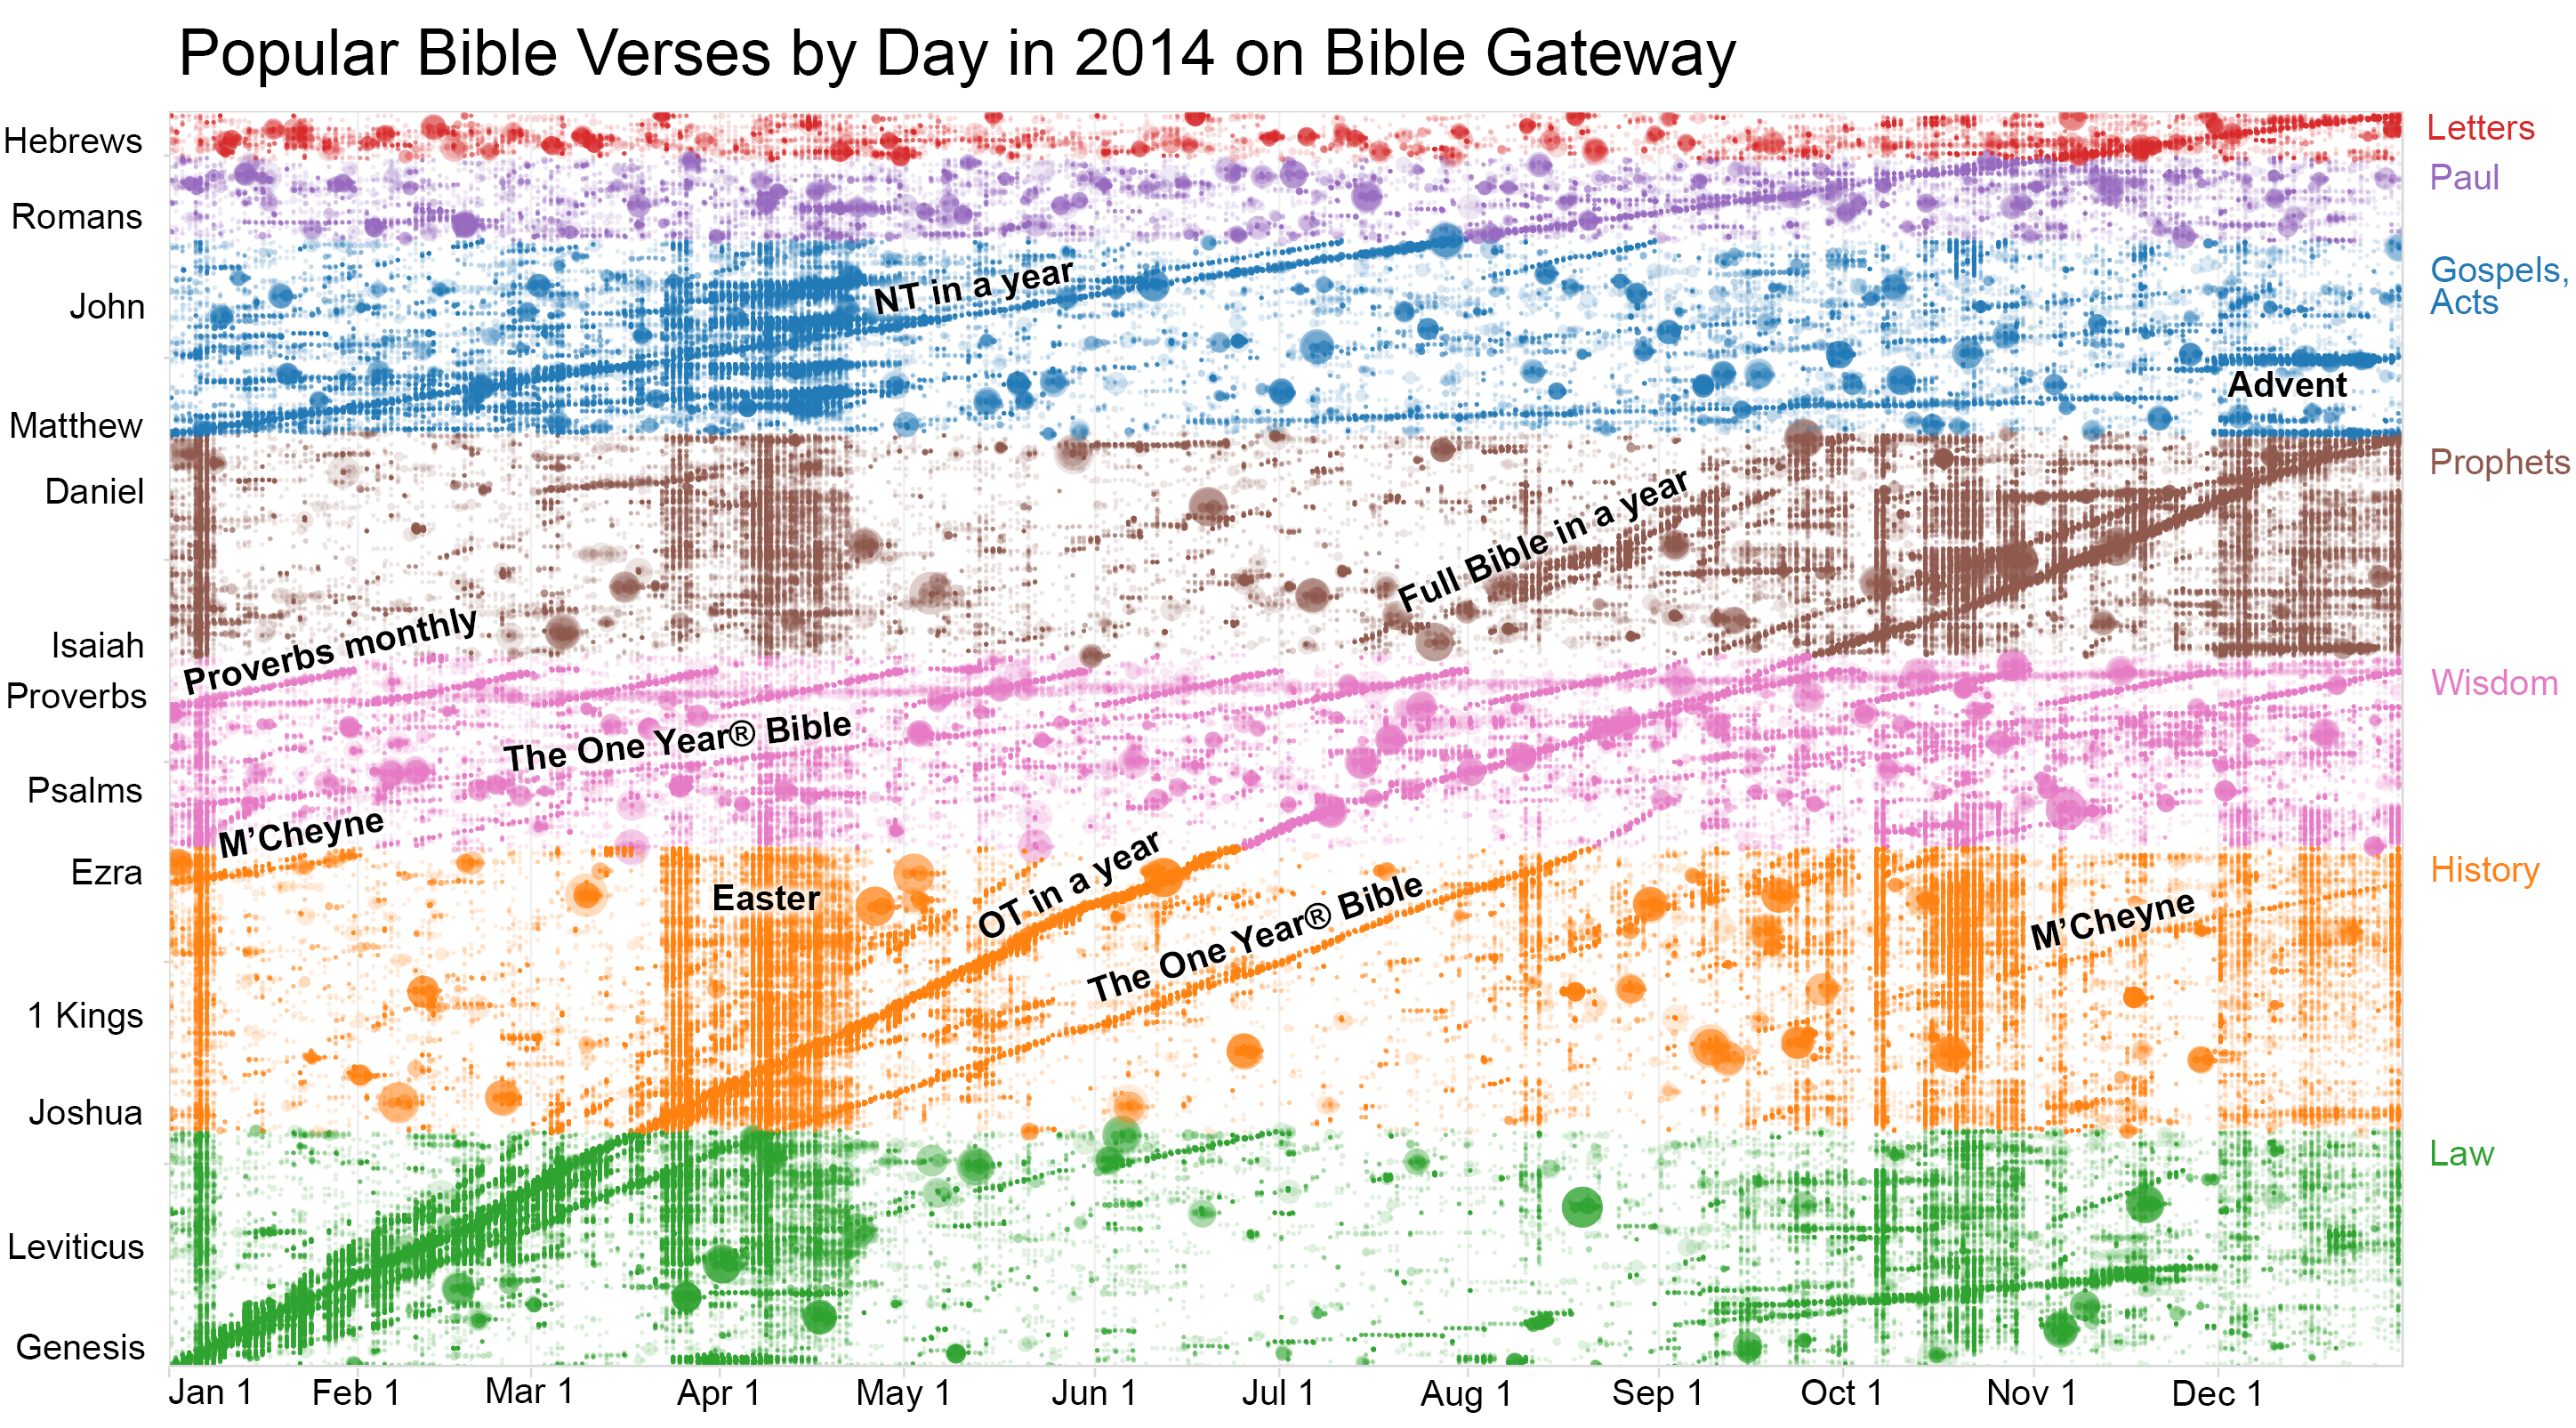
Popular Bible verses by day in 2014 on Bible Gateway

The chart stems from the idea that if someone is equally likely to see a verse on any day of the year, each day should have 1/365, or 0.27%, of a verse’s yearly popularity. This chart shows days when there’s a spike in pageviews for each verse for a particular day (whenever it was over 0.4% of the annual total).

The theme of the chart is that people follow certain paths through the Bible during the year; I labeled a few of them on the chart. But there are definitely a few patterns I can’t explain:

  1. At the beginning of the year, two lines emanate from Genesis that look like they're on track to read the full Bible in a year, but one of them is faster than the other. Why are there two?
  2. At the bottom right of the chart is a shallow line that looks like it involves reading Genesis and Exodus starting in May and ending in December. There's a similar line in the New Testament running through Matthew from June to November. What are those?

I was curious whether the same patterns would appear in Twitter for the year, so I ran a similar analysis on the 43 million tweets this year that mentioned Bible verses. The answer is that, yes, you can see many of the same paths in both charts:

Popular Bible verses by day in 2014 on Twitter

They even include the same two (or three or four) fast readings of the Bible at the beginning of the year and the slow reading of Genesis and Exodus in the second half of the year. You can see similar peaks around the Passion stories leading to Easter and the Nativity story leading to Christmas. (Christmas is the last day that appears on this chart.) The Twitter chart more clearly shows the weekly rhythms of the devotional life, with vertical lines just barely visible every Sunday. The main difference is that there’s not as clear a path through the New Testament.

The Twitter chart also shows some horizontal bands where sharing is pretty light. These “sharing shadows” appear in the opening chapters of Numbers, 1 Kings, and 1 Chronicles.

Prolific Verse Sharers

A quirk of the Twitter chart is that some Twitterers tweet (and are retweeted) a lot. I suspect many of them are bots, but it’s hard to say whether they constitute “Bible spam”–many people do appear to find them helpful by retweeting them. The top fifty or so Twitterers are responsible for 16 million of the 43 million tweets this year. The chart doesn’t look too different if you remove them (mostly, the frequent repetition of Matthew disappears), but that just could be because I didn’t remove enough users to affect the results meaningfully. For all I know, this chart mostly just shows how Twitter bots share the Bible during the year. The consistency with the Bible Gateway data (in which I have more confidence), however, leads me to think that this picture is reasonably accurate.

Here are the top non-bot (as far as I can tell) sharers of Bible verses–these people tweeted the most Bible verses (and, more importantly, were retweeted most) throughout the year. Some of these people I recognize, and others… not so much. The “tweet” numbers reflect only tweets containing Bible verses and include others’ retweets of their tweets.

  1. JohnPiper (105,836 tweets)
  2. DangeRussWilson (87,382 tweets)
  3. WeLiftYourName (52,638 tweets)
  4. JosephPrince (50,889 tweets)
  5. BishopJakes (49,109 tweets)
  6. siwon407 (48,994 tweets)
  7. RickWarren (42,637 tweets)
  8. JoyceMeyer (39,703 tweets)
  9. jeremycamp (32,003 tweets)
  10. DaveRamsey (28,173 tweets)
  11. RCCGworldwide (26,731 tweets)
  12. AdamCappa (25,976 tweets)
  13. Creflo_Dollar (24,422 tweets)
  14. sadierob (20,068 tweets)
  15. Carson_Case (19,846 tweets)
  16. TimTebow (18,303 tweets)
  17. Kevinwoo91 (17,230 tweets)
  18. levimitchell (16,355 tweets)
  19. jesse_duplantis (15,755 tweets)
  20. kutless (14,806 tweets)

Most-Popular Verses

Here are the most-popular verses shared on Twitter in 2014:

  1. Phil 4:13 (613,161 tweets)
  2. 1Pet 5:7 (261,417 tweets)
  3. Prov 3:5 (218,019 tweets)
  4. John 14:6 (212,883 tweets)
  5. John 13:7 (207,084 tweets)
  6. 1Cor 13:4 (197,379 tweets)
  7. Matt 28:20 (187,407 tweets)
  8. Ps 118:24 (183,475 tweets)
  9. 2Tim 1:7 (182,758 tweets)
  10. Ps 56:3 (180,139 tweets)

You can also download a text file (411 KB) with the complete list of 2014’s popular verses.

John 13:7 (“Jesus replied, ‘You do not realize now what I am doing, but later you will understand.’”) is the oddball here, but it turns out that it’s mostly from over 100,000 retweets of a single tweet in April. (Since it was a one-off, I omitted him from the list of top sharers above, although his tweet count of 163,497 would put him in first place.)

How do the year’s most-popular verses compare among Bible Gateway, YouVersion, and Twitter? The answer: there’s a good deal of variation. Below are the top ten from each service; only Proverbs 3:5 appears in all three lists, and YouVersion and Twitter only have one verse that overlaps, which surprises me (given that they’re both based on sharing).

If we look only at Bible Gateway and Twitter, the average verse differs in its ranking by about 3,000 places, or nearly 10% of the Bible. The largest differences in rank: 1 Kings 20:14 is much more popular on Twitter (rank 4,380) than on Bible Gateway (rank 27,119), while Ezra 5:14 is way more popular on Bible Gateway (rank 13,995) than Twitter (rank 30,018).

RankingBible GatewayYouVersionTwitter
1.John 3:16Rom 12:2Phil 4:13
2.Jer 29:11Phil 4:81Pet 5:7
3.Phil 4:13Phil 4:6Prov 3:5
4.Rom 8:28Jer 29:11John 14:6
5.Ps 23:4Matt 6:33John 13:7
6.Phil 4:6Phil 4:71Cor 13:4
7.1Cor 13:4Prov 3:5Matt 28:20
8.Prov 3:5Isa 41:10Ps 118:24
9.1Cor 13:7Matt 6:342Tim 1:7
10.Rom 12:2Prov 3:6Ps 56:7
Bold entries appear in at least two lists.

Data Source

The Twitter data is from Bible Verses on Twitter. A program connects to the Twitter Streaming API with a query for every chapter of the Bible (“Gen 1”, “Genesis 1”, and so on). I run a Bible reference parser on the tweet to pull out all the references. Then an SVM algorithm tries to guess whether the tweet is actually talking about a Bible verse or just happens to contain a string that looks like a Bible reference (“Gen 1 XBox for sale,” where “Gen” is short for “Generation”).

Sidenote: How I Calculate Verse Views

A note on methodology: I’ve never documented how I determine a particular verse’s popularity; now’s a good time, because you can do it a number of ways to reach different answers. Let’s say that someone is looking at Genesis 1, which has 31 verses. That counts as one pageview, but if you’re looking for the number of pageviews that, say, Genesis 1:1 receives, how do attribute a chapter-length view like this? You could give each verse credit for a full pageview, but then verses in long chapters will appear to have a disproportionately high number of pageviews. Instead, I prefer to divide the pageview into the number of verses in the passage: in this case, each verse in Genesis 1 will receive 1/31, or 0.032 pageviews.

Now, what if someone is looking at, say, Genesis 1:1 and Matthew 1 (25 verses) on the same page? In this case, I divide the pageview by the number of separate passages: Genesis 1:1 receives credit for a full 0.5 pageviews, as does Matthew 1. Each verse in Matthew 1 therefore receives 0.5/25, or 0.02 pageviews.

I feel that this approach best respects people’s intentions whether they want to look at multiple verses, several independent passages, or just individual verses.

Posted in Bible, Twitter, Visualizations

What Twitterers Are Giving up for Lent (2014 Edition)

The top 100 things that people on Twitter are giving up for Lent in 2014.

This year, “School” topped the list of things Twitterers are giving up for Lent, up 44 places from last year. Remaining in the top ten from last year are Swearing, Alcohol, Soda, Social Networking, and Fast Food. Chocolate, Twitter, Sweets, and Lent round out the new additions to the top ten.

I don’t have a great explanation for why School is #1 this year–it could be that Ash Wednesday is later this year, so spring break is closer (for some it even starts today). It’s also possible that Twitter’s audience is skewing younger than it used to, or that younger Twitter users are more likely to tweet about Lent.

Timely topics this year are Boosie, referring to rapper Lil Boosie, who was released from prison this week (people joked that the prison was giving him up for Lent); and Electricity, referring to a widespread power outage in South Africa.

This list draws from 646,000 tweets during March 2 to 8 that mention giving up something for Lent and excludes retweets.

RankWordCountChange from last year’s rank
1.School11,757+44
2.Chocolate9,515+15
3.Twitter8,642+8
4.Swearing7,132-2
5.Alcohol6,3250
6.Soda5,446-3
7.Social networking4,197-3
8.Sweets4,188+8
9.Fast food4,0880
10.Lent2,842+118
11.Meat2,790+26
12.Homework2,760+61
13.Junk food2,723+8
14.Coffee2,678+123
15.Sex2,392+112
16.Chips2,129-10
17.Bread2,020+114
18.You2,016+21
19.Facebook1,9260
20.Pizza1,628+122
21.Starbucks1,566+120
22.Candy1,412+87
23.Instagram1,212-13
24.Religion1,147+104
25.Virginity1,143-18
26.Cookies1,053-14
27.Work1,031+4
28.Ice cream1,025+27
29.Boys1,021+99
30.Marijuana1,018-22
31.Smoking994-9
32.Beer939+104
33.Life933-8
34.Food930+27
35.McDonalds926+20
36.Winter853 
37.Netflix851-7
38.College819+16
39.My phone777+6
40.Shopping748+103
41.Stuff733+100
42.Selfies731+1
43.Chipotle726+100
44.Masturbation725-30
45.Sugar682+82
46.Cheese670+94
47.Me656+87
48.Sobriety655-17
49.Wine652+94
50.Carbs648+81
51.Boosie581 
52.Fried food574-23
53.Caffeine563+70
54.Rice562+86
55.Catholicism561-28
56.Snapchat543+11
57.Coke541-22
58.Procrastination517-18
59.People516+54
60.Snow506 
61.Desserts486-37
62.Fizzy drinks480+81
63.French fries475-29
64.Takeout464-49
65.Obama452+74
66.Makeup451-25
67.Taco Bell434+39
68.Feelings434-32
68.Porn430 
69.Nothing427+74
70.My swag420-47
71.Negativity417+28
72.Red meat396+59
73.Diet Coke390+69
74.Sarcasm380 
75.Breathing369 
76.Caring357+66
77.Complaining354 
78.Tea352+64
79.Pancakes340+63
80.Peanut butter336 
81.Sweet tea335 
82.Booze325+61
83.Sleep320+33
84.Hope316+46
85.Cake313-13
86.Pasta303+57
87.TV302+30
88.Texting297+52
89.Eating out275-29
90.Exercise274-47
91.Pants270+5
92.Electricity268+41
93.The gym258+16
94.Liquor245 
95.Church243-46
96.Tinder237+35
97.Tumblr236+46
98.Math236+20
98.Juice232+35
99.Being mean230 
100.Chick Fil A228-38

Categories

RankCategoryNumber of Tweets
1.food62,453
2.school/work18,148
3.technology17,615
4.habits16,616
5.smoking/drugs/alcohol12,665
6.irony7,319
7.relationship6,563
8.sex5,483
9.health/hygiene3,476
10.religion2,784
11.generic2,504
12.entertainment1,959
13.weather1,496
14.shopping1,183
15.celebrity961
16.sports780
17.politics547
18.clothes540
19.money492
20.habit393
21.possessions217
22.clothing62

Historical Trends

This year I added a new Historical Lent Tracker that you can use to investigate Lenten trends on your own over the past six years.

Here are some of my favorite graphs:

Second-Wave Social Media

Tumblr peaked in 2011, and WhatsApp, which Facebook recently paid $19 billion for, doesn’t register highly.

Instagram is highest, followed by Snapchat, Tumblr, Tinder, and Whatsapp

Fast Food Restaurants

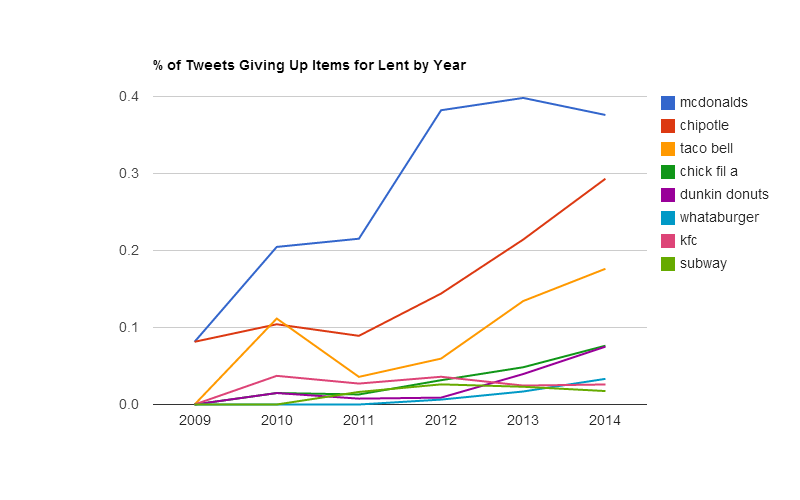
Chipotle is much higher on the list than I expected–is that because people love it or because they hate it?

McDonald's is highest, followed by Chipotle, Taco Bell, Chick-Fil-A, Dunkin Donuts, Whataburger, KFC, and Subway.

One Direction vs. Justin Bieber

One Direction has been outpacing Justin Bieber since 2012.

Snack Foods

Congratulations, Hot Cheetos, on being the snack the most people want to give up.

Hot Cheetos is highest, followed by popcorn, Doritos, potato chips, and Cheetos.

Media Coverage

The Lent Tracker got some media attention this year. In roughly chronological order:

Finally, this Wall Street Journal article doesn’t talk about the Lent tracker, but it discusses the fraught phenomenon of Ash Wednesday selfies: Selfies Bring Ashtags to Lent. (This article may or may not be behind a paywall for you.)

Posted in Lent, Twitter

Track What People Are Giving Up in 2014 for Lent in Real Time

See the top 100 things people are giving up in 2014 for Lent on Twitter, continually updated until March 7, 2014.

As I write this post, with about 5,000 tweets analyzed, the new hot topics so far this year are: “Netflix,” “Flappy Bird,” and “Getting an Oscar.” “Social Networking” is currently way out in front, with twice as many tweets as perennial favorites “Swearing” and “Alcohol.” (Last year, Social Networking came in at #4.)

Look for the usual post-mortem on March 8, 2014.

Posted in Lent, Twitter

What Twitterers Are Giving up for Lent (2013 Edition)

The top 100 things that people on Twitter are giving up for Lent in 2013.

This year saw a lot of churn in the top 100 things people were giving up for Lent.

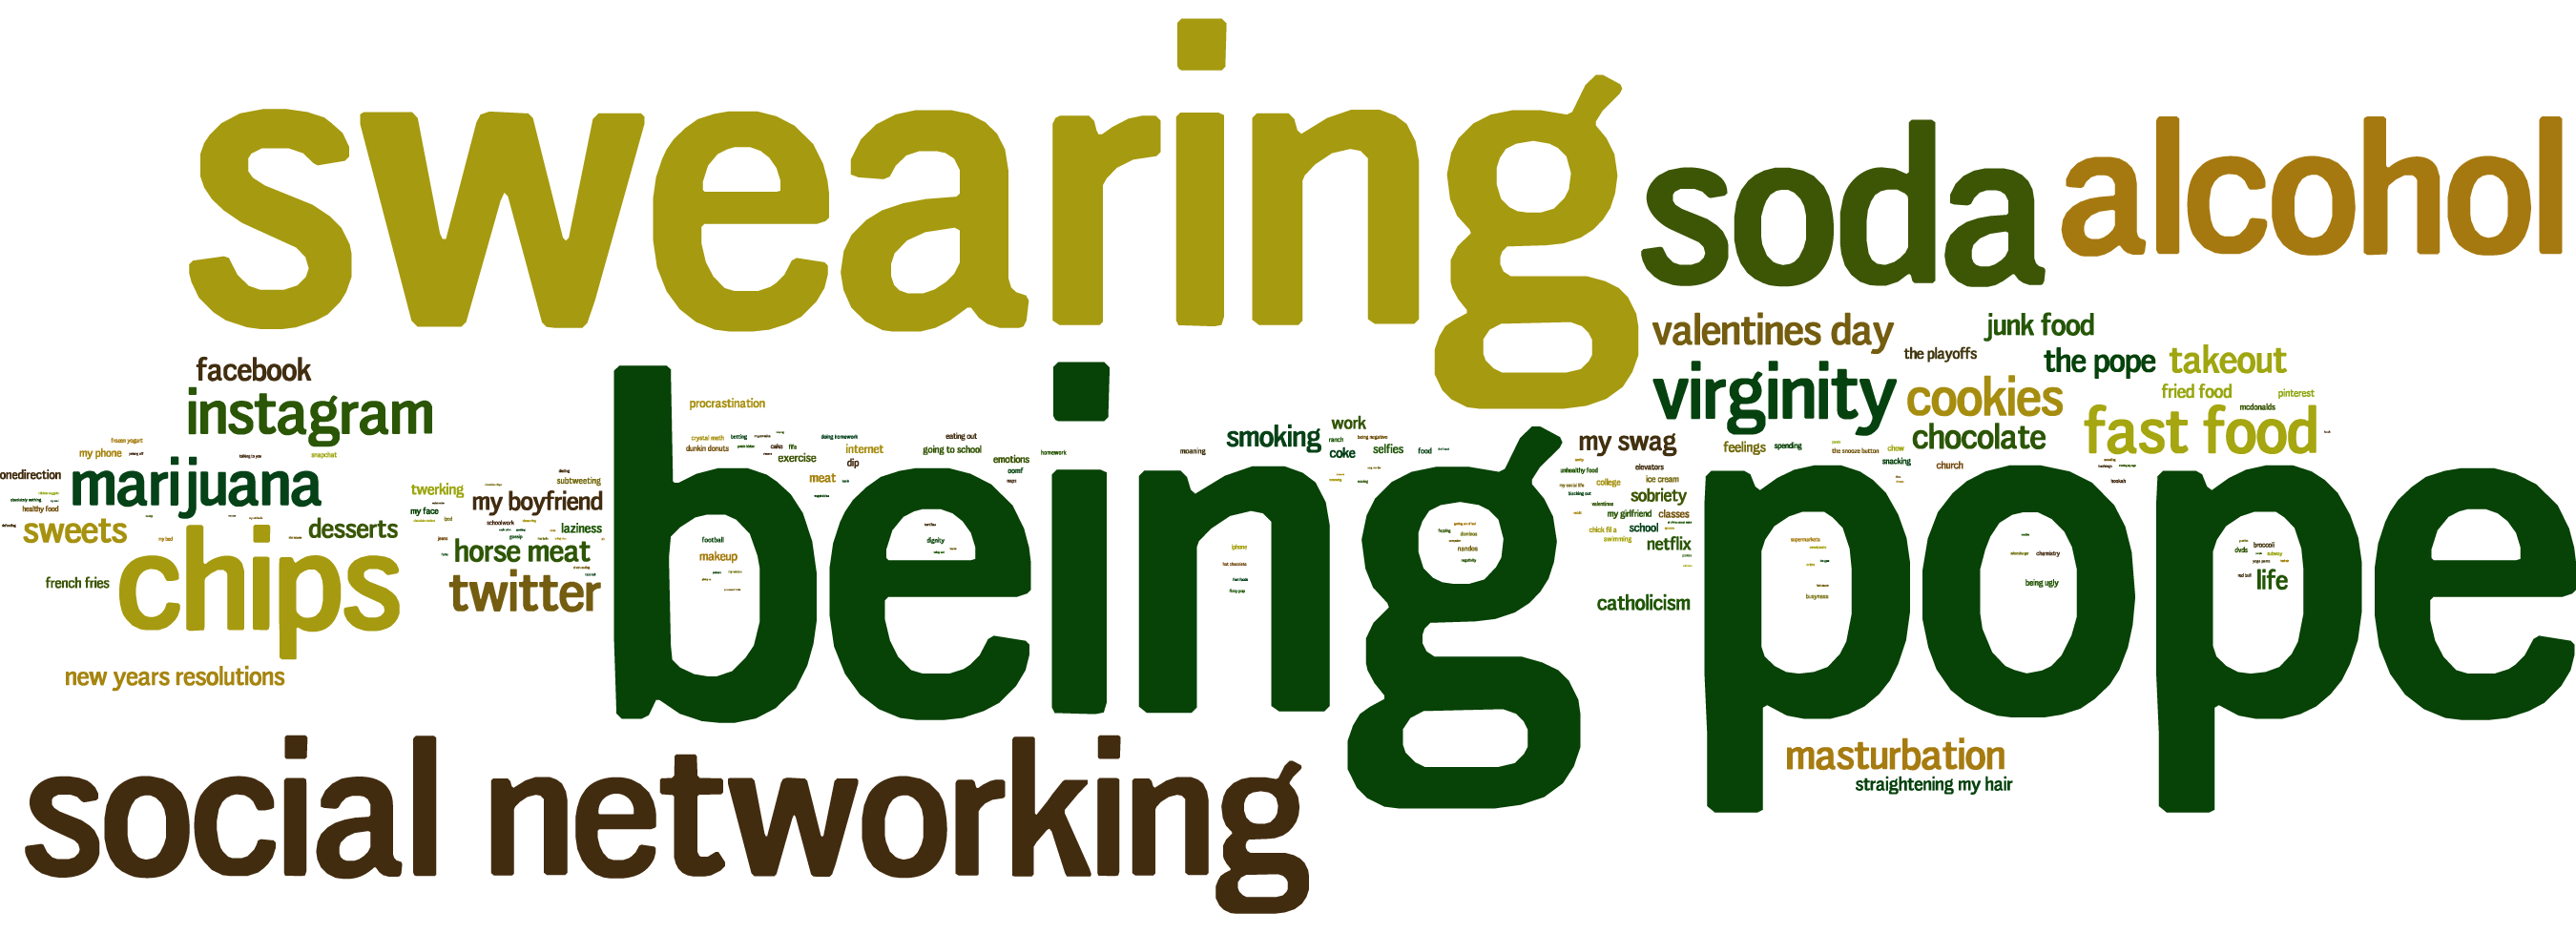
The pope announced his resignation on Monday, leading many to say that he was giving up “being pope” for Lent. It came in at #1. (Related, at #18, people said they were giving up “the pope” for Lent.)

Specific social networking sites like Twitter and Facebook generally dropped this year, with the generic term “social networking” (#4) taking over as a catchall. Instagram (#10), Pinterest (#52), and Snapchat (#78) were all new to the top 100.

With Valentine’s Day falling on the day after Ash Wednesday this year, it came in at #13. My wife suggests that the timing may also have contributed to the drop in “chocolate” from #2 last year to #17 this year. “Valentines” is #97.

“Horse meat” (#20) refers to the ongoing European scandal.

The only celebrity to make the list was British boy band One Direction, up substantially at #41.

I learned several new words this year: “twerking” (#34), a type of dance move, “selfies” (#46), or self-shot photos taken with a phone, “subtweeting” (#57), or tweeting about someone without mentioning them by name, “oomf” (#71), or “one of my [Twitter] followers,” and “Nando’s” (#76), a chicken restaurant.

This list draws from 263,000 tweets from February 10-15, 2013, and excludes most retweets.

RankWordCountChange from last year’s rank
1.Being pope5,654 
2.Swearing4,944+1
3.Soda2,648+2
4.Social networking2,264+19
5.Alcohol2,217-1
6.Chips1,690+8
7.Virginity933+23
8.Marijuana784+17
9.Fast food776-2
10.Instagram755+270
11.Twitter672-10
12.Cookies643+19
13.Valentine's day514 
14.Masturbation510+18
15.Takeout465+59
16.Sweets444-7
17.Chocolate417-15
18.The pope394+10,224
19.Facebook380-13
20.Horse meat375 
21.Junk food362-8
22.Smoking355-3
23.My swag331+373
24.Desserts325+21
25.Life325+40
26.New year's resolutions313+47
27.My boyfriend309+99
28.Catholicism255+11
29.Straightening my hair228+89
30.Fried food225+5
31.Netflix216+255
32.Work216-5
33.Sobriety213+4
34.Twerking185+698
35.The playoffs184+3,556
36.French fries173+19
37.Coke168+1
38.Feelings168+207
39.Laziness160+28
40.Meat158-30
41.Onedirection155+103
42.You154-24
43.Procrastination153+1
44.Makeup150+16
45.Internet149+61
46.Selfies149+2,328
47.Exercise144+58
48.School141-36
49.My phone135+15
50.Classes129+84
51.Dip127+132
52.Pinterest125+133
53.Church124+33
54.Emotions122+397
55.Going to school119+163
56.My girlfriend111+207
57.Subtweeting110+253
58.College106+5
59.My face106+4,168
60.Ice cream106-27
61.McDonald's102-32
62.Being ugly101+256
63.Snacking99+19
64.Spending96+89
65.Dunkin Donuts96+475
66.Chew95+418
67.Eating out94+28
68.Elevators94+99
69.Food93-47
70.Moaning93+123
71.Oomf93+78
72.Chick Fil A90+135
73.Healthy food88+180
74.Football87+145
75.Swimming87+200
76.Nando's86+72
77.DVDs84+1,326
78.Snapchat84 
79.Broccoli83+206
80.Ranch81+250
81.The snooze button80+176
82.Crystal meth80+219
83.Dignity79+116
84.Cake77-13
85.Unhealthy food77+34
86.Homework76-65
87.Busyness75 
88.Schoolwork74+88
89.Chemistry74+34,949
90.Frozen yogurt72+480
91.iPhone72+100
92.FIFA71+143
93.Betting70+315
94.Doing homework69+158
95.Myself68+267
96.Supermarkets67+1,797
97.Valentines66 
98.Domino's63+323
99.Being negative63+212
100.Hookah63+340

Categories

RankCategoryNumber of Tweets
1.food11,642
2.habits8,083
3.religion6,519
4.technology4,782
5.smoking/drugs/alcohol3,928
6.sex1,771
7.relationship1,399
8.health/hygiene1,270
9.school work1,095
10.irony792
11.sports648
12.entertainment392
13.celebrity246
14.clothes235
15.money133
16.shopping111

The image is a Wordle.

Posted in Lent, Twitter

What Twitterers Are Giving up for Lent (2012 Edition)

The top 100 things that people on Twitter are giving up for Lent in 2012.

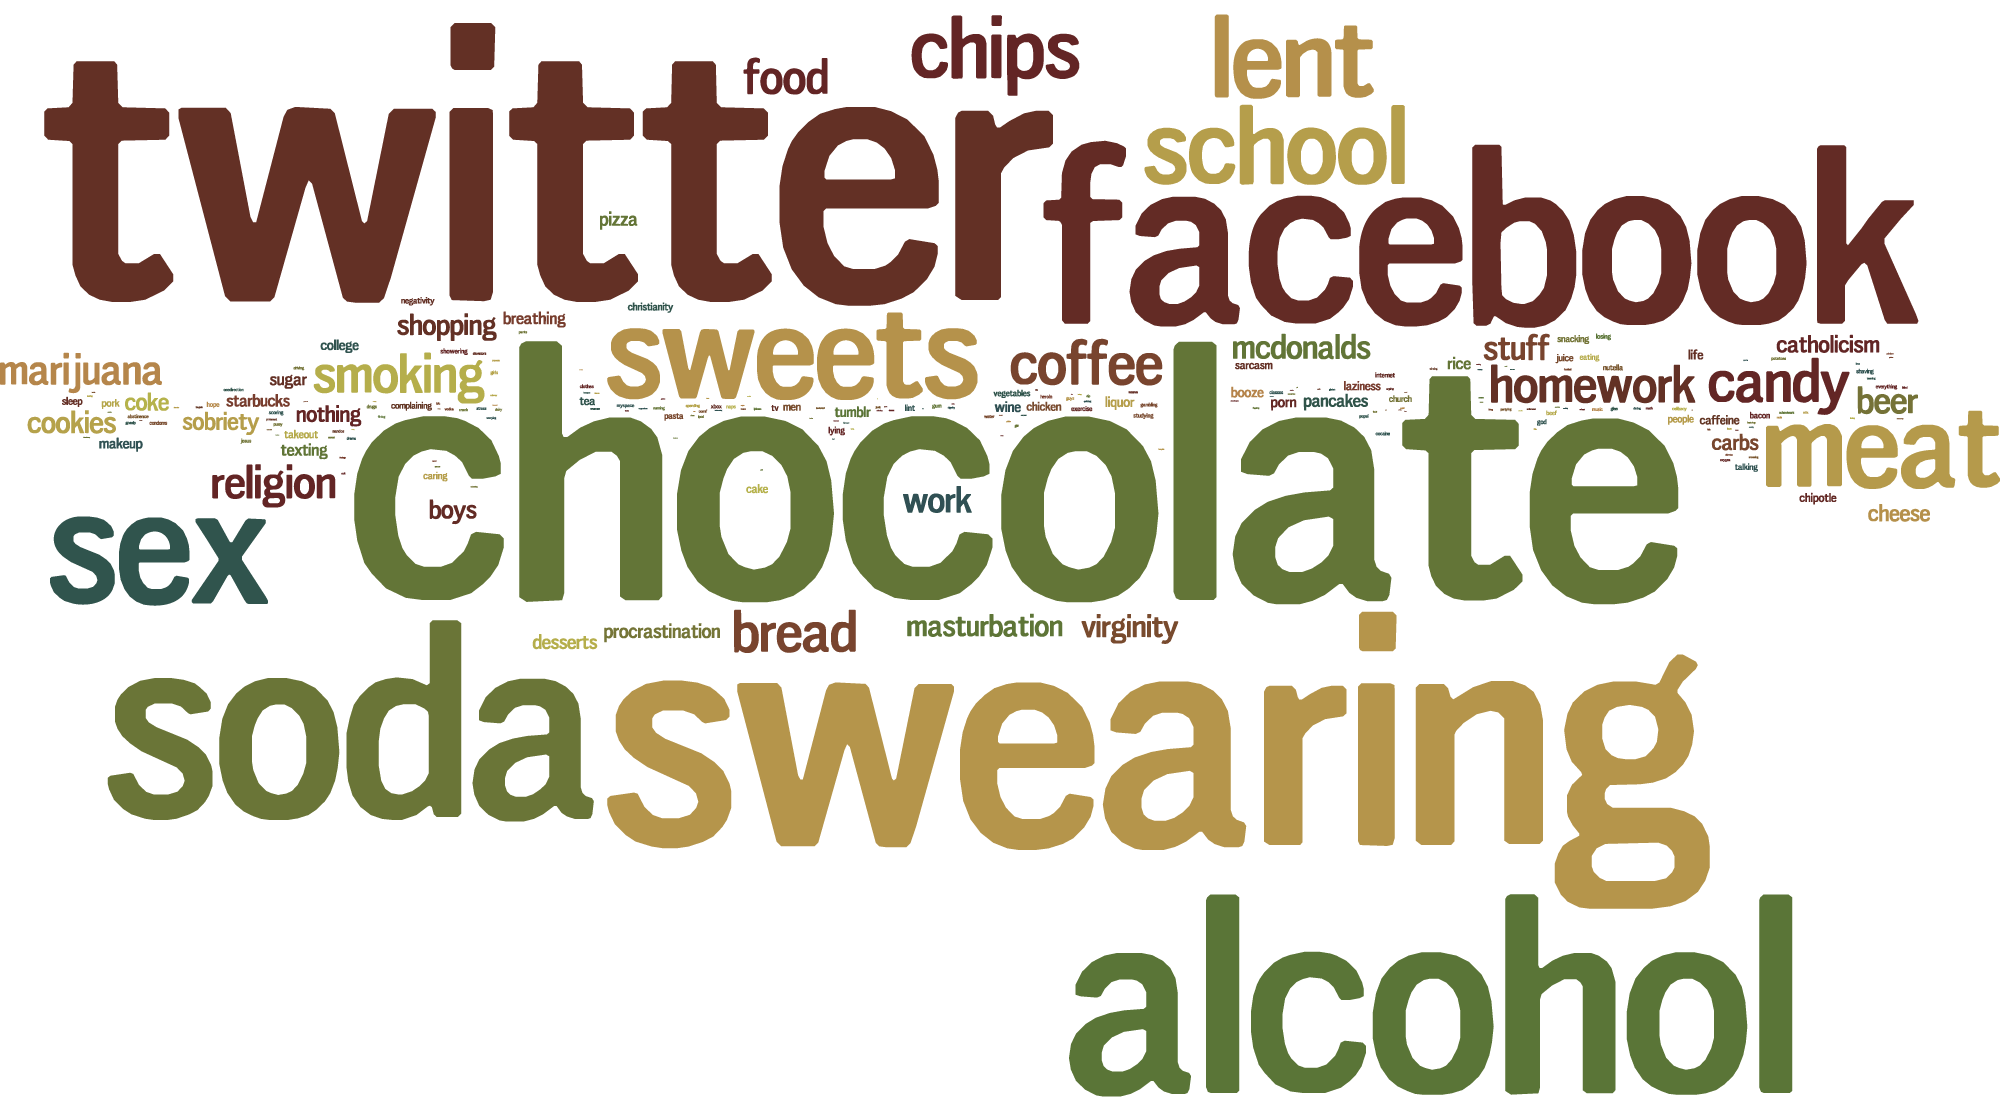
This year, Twitter continues to take top honors. Facebook drops a few places compared to last year–has it become less-central to people’s lives? This year’s hot new site, Pinterest, almost makes the list, showing up at #118. (Incidentally, Pinterest has a number of Lent-related boards.)

Chocolate comes in at #2–however, if you add up all the mentions of chocolate in its various forms (“chocs,” “chocolate chips,” etc.), it totals over 14,000 mentions, enough to put it at #1.

This year’s biggest gainers are “breathing” and “makeup,” both of which jumped up more than 30 places in the list.

No celebrities make the top 100 this year. Boy band One Direction (aka #1D) is at #144, followed by Justin Bieber at #194 and Tim Tebow at #221. Last year’s curiosity, Charlie Sheen, only got two mentions; he dropped to #10,000 or so.

Overall, food was by far the most popular thing given up.

This list draws from about 300,000 tweets from February 19-25, 2012, and excludes retweets.

RankWordCountChange from last year’s rank
1.Twitter13,9370
2.Chocolate13,001+1
3.Swearing11,737+1
4.Alcohol9,998+1
5.Soda9,942+2
6.Facebook9,025-4
7.Fast food6,529+3
8.Sex6,146-2
9.Sweets4,973+2
10.Meat4,444-1
11.Lent4,171-3
12.School3,976+1
13.Junk food3,388+6
14.Chips3,150+4
15.Coffee2,2630
16.Candy2,217+6
17.Bread2,124+3
18.You2,056-2
19.Smoking2,002+2
20.Giving up things2,001-8
21.Homework1,908+11
22.Food1,800+5
23.Social networking1,754-6
24.Religion1,701-10
25.Marijuana1,594+4
26.Beer1,359+4
27.Work1,331-3
28.Stuff1,302-3
29.McDonald's1,249+21
30.Virginity1,152+7
31.Cookies1,137+3
32.Masturbation1,134+4
33.Ice cream1,113+15
34.Shopping1,068-6
35.Fried food993-4
36.Boys956+6
37.Sobriety910+7
38.Coke899+3
39.Catholicism881-13
40.Cheese858-7
41.Nothing831+5
42.Carbs818+16
43.Red meat758-8
44.Procrastination738+1
45.Desserts733+26
46.Pizza714+15
47.Pancakes650-9
48.Sugar645-5
49.Rice633-10
50.Breathing631+34
51.Me628+12
52.Texting627+3
53.Starbucks623+1
54.Fizzy drinks595+12
55.French fries593+7
56.Diet Coke572+21
57.Porn562+10
58.Tumblr548+12
59.Wine546-7
60.Makeup539+31
61.Liquor534-5
62.Booze530-22
63.College524+18
64.My phone508+30
65.Life486 
66.Caffeine466-17
67.Laziness453+11
68.Chipotle452+30
69.Tea445+6
70.Chicken442+2
71.Cake440+3
72.Sarcasm429+4
73.New Year's resolutions422+15
74.Takeout417+11
75.Men412-10
76.Pork394-3
77.Christianity388-18
78.Sleep386+1
79.People384+8
80.Caring377 
81.Juice357+11
82.Snacking345 
83.Lying333 
84.TV332-31
85.Complaining331-2
86.Church328-35
87.Him327+2
88.Sweet tea326 
89.Lint326-21
90.Vegetables324 
91.Talking323 
92.Bacon321 
93.Being mean320 
94.Pasta316 
95.Eating out316+5
96.Negativity314-39
97.Eating298 
98.Biting my nails294 
99.Nutella291 
100.Being nice258 

Categories

RankCategoryNumber of Tweets
1.food79,977
2.habits21,836
3.technology19,190
4.smoking/drugs/alcohol19,073
5.health/hygiene11,101
6.sex9,948
7.irony9,352
8.school/work8,567
9.relationship6,919
10.religion4,157
11.generic2,841
12.shopping1,491
13.entertainment1,344
14.money526
15.sports512
16.celebrity461
17.possessions376
18.clothes111
19.politics105

The image is a Wordle.

Posted in Lent, Twitter

Bible Annotation Modeling and Querying in MySQL and CouchDB

If you’re storing people’s Bible annotations (notes, bookmarks, highlights, etc.) digitally, you want to be able to retrieve them later. Let’s look at some strategies for how to store and look up these annotations.

Know What You’re Modeling

First you need to understand the shape of the data. I don’t have access to a large repository of Bible annotations, but the Twitter and Facebook Bible citations from the Realtime Bible Search section of this website provide a good approximation of how people cite the Bible. (Quite a few Facebook posts appear to involve people responding to their daily devotions.) These tweets and posts are public, and private annotations may take on a slightly different form, but the general shape of the data should be similar: nearly all (99%) refer to a chapter or less.

Large dots at the bottom indicate many single-verse references. Chapter references are also fairly prominent. See below for more discussion.

Compare Bible Gateway reading habits, which are much heavier on chapter-level usage, but 98% of accesses still involve a chapter or less.

The Numbers

The data consists of about 35 million total references.

Percent of Total Description Example
73.5 Single verse John 3:16
17.1 Verse range in a single chapter John 3:16-17
8.4 Exactly one chapter John 3
0.7 Two or more chapters (at chapter boundaries) John 3-4
0.1 Verses spanning two chapters (not at chapter boundaries) John 3:16-4:2
0.1 Verses spanning three or more chapters (not at chapter boundaries) John 3:16-5:2

About 92.9% of posts or tweets cited only one verse or verse range; 7.1% mentioned more than one verse range. Of the latter, 77% cited exactly two verse ranges; the highest had 323 independent verse ranges. Of Facebook posts, 9.1% contained multiple verse ranges, compared to 4.2% of tweets. When there were multiple ranges, 43% of the time they referred to verses in different books from the other ranges; 39% referred to verses in the same book (but not in the same chapter); and 18% referred to verses in the same chapter. (This distribution is a unusual—normally close verses stick together.)

The data, oddly, doesn’t contain any references that span multiple books. Less than 0.01% of passage accesses span multiple books on Bible Gateway, which is probably a useful upper bound for this type of data.

Key Points

  1. Nearly all citations involve verses in the same chapter; only 1% involve verses in multiple chapters.
  2. Of the 1% spanning two or more chapters, most refer to exact chapter boundaries.
  3. Multiple-book references are even more unusual (under 0.01%) but have outsize effects: an annotation that references Genesis 1 to Revelation 22 would be relevant for every verse in the Bible.
  4. Around 7% of notes contained multiple independent ranges of verses—the more text you allow for an annotation, the more likely someone is to mention multiple verses.

Download

Download the raw social data (1.4 MB zip) under the usual CC-Attribution license.

Data Modeling

A Bible annotation consists of arbitrary content (a highlight might have one kind of content, while a proper note might have a title, body, attachments, etc., but modeling the content itself isn’t the point of this piece) tied to one or more Bible references:

  1. A single verse (John 3:16).
  2. A single range (John 3:16-17).
  3. Multiple verses or ranges (John 3:16, John 3:18-19)

The Relational Model

One user can have many rows of annotations, and one annotation can have many rows of verses that it refers to. To model a Bible annotation relationally, we set up three tables that look something like this:

users

user_id name
1

annotations

user_id annotation_id content
1 101
1 102
1 103

annotation_verses

The verse references here are integers to allow for easy range searches: 43 = John (the 43rd book in the typical Protestant Bible); 003 = the third chapter; the last three digits = the verse number.

I like using this approach over others (sequential integer or separate columns for book, chapter, and verse) because it limits the need for a lookup table. (You just need to know that 43 = John, and then you can find any verse or range of verses in that book.) It also lets you find all the annotations for a particular chapter without having to know how many verses are in the chapter. (The longest chapter in the Bible has 176 verses, so you know that all the verses in John 3, for example, fall between 43003001 and 43003176.) This main disadvantage is that you don’t necessarily know how many verses you’re selecting until after you’ve selected them. And using individual columns, unlike here, does allow you to run group by queries to get easy counts.

annotation_id start_verse end_verse
101 43003016 43003016
102 43003016 43003017
103 43003016 43003016
103 43003019 43003020

Querying

In a Bible application, the usual mode of accessing annotations is by passage: if you’re looking at John 3:16-18, you want to see all your annotations that apply to that passage.

Querying MySQL

In SQL terms:

select distinct(annotations.annotation_id)
from annotations, annotation_verses
where annotation_verses.start_verse <= 43003018 and
annotation_verses.end_verse >= 43003016 and
annotations.user_id = 1 and
annotations.annotation_id = annotation_verses.annotation_id
order by annotation_verses.start_verse asc, annotation_verses.end_verse desc

The quirkiest part of the SQL is the first part of the “where” clause, which at first glance looks backward: why is the last verse in the start_verse field and the first verse in the end_verse field? Because the start_verse and end_verse can span any range of verses, you need to make sure that you get any range that overlaps the verses you’re looking for: in other words, the start_verse is before the end of the range, and the end_verse is after the start.

Visually, you can think of each start_verse and end_verse pair as a line: if the line overlaps the shaded area you’re looking for, then it’s a relevant annotation. If not, it’s not relevant. There are six cases:

Start before, end before: John 3:15 / Start before, end inside: John 3:15-17 / Start before, end after: John 3:15-19 / Start inside, end inside: John 3:16-18 / Start inside, end after: John 3:17-19 / Start after, end after: John 3:19

The other trick in the SQL is the sort order: you generally want to see annotations in canonical order, starting with the longest range first. In other words, you start with an annotation about John 3, then to a section inside John 3, then to individual verses. In this way, you move from the broadest annotations to the narrowest annotations. You may want to switch up this order, but it makes a good default.

The relational approach works pretty well. If you worry about the performance implications of the SQL join, you can always put the user_id in annotation_verses or use a view or something.

Querying CouchDB

CouchDB is one of the oldest entrants in the NoSQL space and distinguishes itself by being both a key-value store and queryable using map-reduce: the usual way to access more than one document in a single query is to write Javascript to output the data you want. It lets you create complex keys to query by, so you might think that you can generate a key like [start_verse,end_verse] and query it like this: ?startkey=[0,43003016]&endkey=[43003018,99999999]

But no. Views are one-dimensional, meaning that CouchDB doesn’t even look at the second element in the key if the first one matches the query. For example, an annotation with both a start and end verse of 19001001 matches the above query, which isn’t useful for this purpose.

I can think of two ways to get around this limitation, both of which have drawbacks.

GeoCouch

CouchDB has a plugin called GeoCouch that lets you query geographic data, which actually maps well to this data model. (I didn’t come up with this approach on my own: see Efficient Time-based Range Queries in CouchDB using GeoCouch for the background.)

The basic idea is to treat each start_verse,end_verse pair as a point on a two-dimensional grid. Here’s the above social data plotted this way:

A diagonal line starts in the bottom left corner and continues to the top right. Large dots indicate popular verses, and book outlines are visible.

The line bisects the grid diagonally since an end_verse never precedes a start_verse: the diagonal line where start_verse = end_verse indicates the lower bound of any reference. Here are some points indicating where ranges fall on the plot:

This chart looks the same as the previous one but has points marked to illustrate that longer ranges are farther away from the bisecting line.

To find all the annotations relevant to John 3:16-18, we draw a region starting in the upper left and continuing to the point 43003018,43003016:

This chart looks the same as the previous one but has a box from the top left ending just above and past the beginning of John near the upper right of the chart.

GeoCouch allows exactly this kind of bounding-box query: ?bbox=0,43003016,43003018,99999999

You can even support multiple users in this scheme: just give everyone their own, independent box. I might occupy 1x1 (with an annotation at 1.43003016,1.43003016), while you might occupy 2x2 (with an annotation at 2.43003016,2.43003016); queries for our annotations would never overlap. Each whole number to the left of the decimal acts as a namespace.

The drawbacks:

  1. The results aren’t sorted in a useful way. You’ll need to do sorting on the client side or in a show function.
  2. You don’t get pagination.

Repetition at Intervals

Given the shape of the data, which is overwhelmingly chapter-bound (and lookups, which at least on Bible Gateway are chapter-based), you could simply repeat chapter-spanning annotations at the beginning of every chapter. In the worst case annotation (Genesis 1-Revelation 22), you end up with about 1200 repetitions.

For example, in the Genesis-Revelation case, for John 3 you might create a key like [43000000.01001001,66022021] so that it sorts at the beginning of the chapter—and if you have multiple annotations with different start verses, they stay sorted properly.

To get annotations for John 3:16-18, you’d query for ?startkey=[43003000]&endkey=[43003018,{}]

The drawbacks:

  1. You have to filter out all the irrelevant annotations: if you have a lot of annotations about John 3:14, you have to skip through them all before you get to the ones about John 3:16.
  2. You have to filter out duplicates when the range you’re querying for spans multiple chapters.
  3. You’re repeating yourself, though given how rarely a multi-chapter span (let alone a multi-book span) happens in the wild, it might not matter that much.

Other CouchDB Approaches

Both these approaches assume that you want to make only one query to retrieve the data. If you’re willing to make multiple queries, you could create different list functions and query them in parallel: for example, you could have one for single-chapter annotations and one for multi-chapter annotations. See interval trees and geohashes for additional ideas. You could also introduce a separate query layer, such as elasticsearch, to sit on top of CouchDB.

Posted in Data Modeling, Twitter, Visualizations

What Twitterers Are Giving up for Lent (2011 Edition)

The top 100 things that people on Twitter are giving up for Lent in 2011.

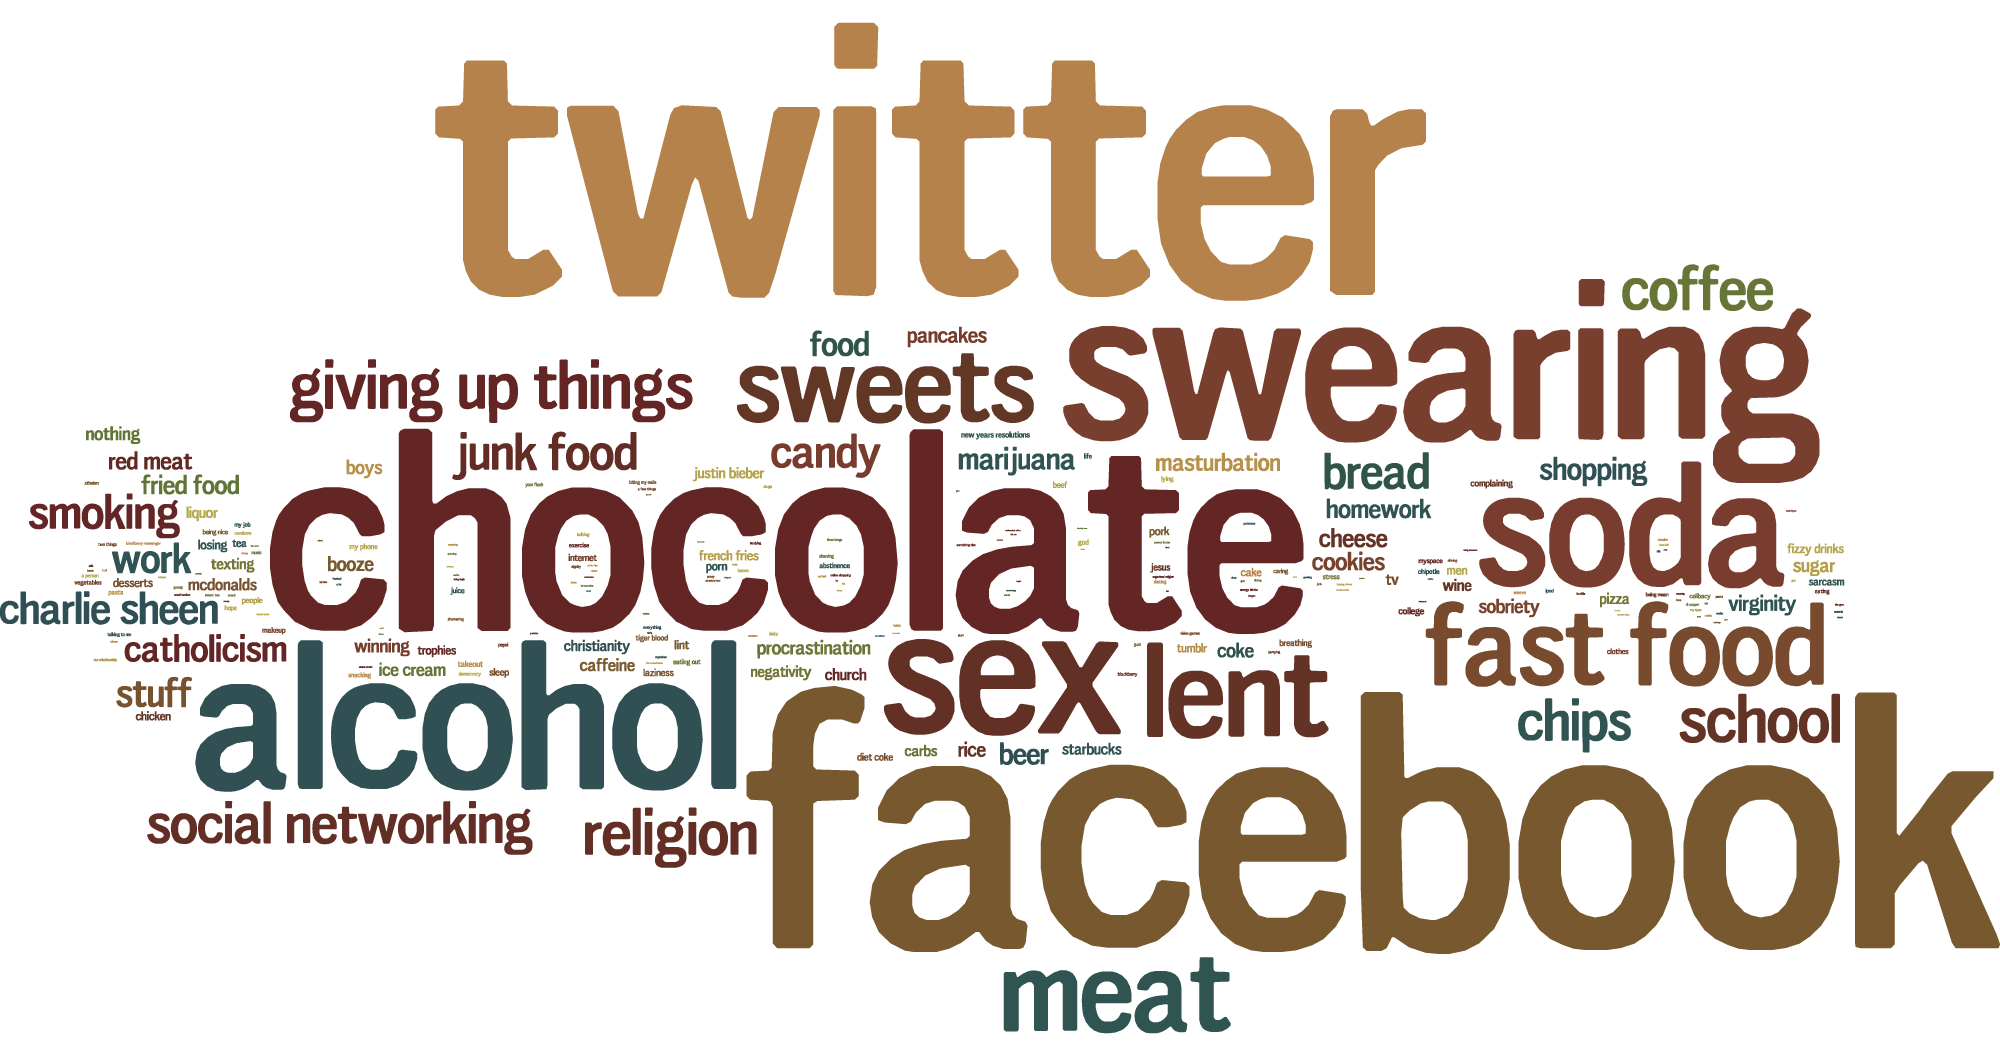
Congratulations, I guess, go this year to Charlie Sheen, who came in at both #23 and, with “tiger blood,” at #90. Justin Bieber is up several spots this year, so he hasn’t quite crested yet. The next-highest celebrity, who didn’t make the top 100, is British boy band One Direction.

“Trophies,” at #69, refers to the English soccer club Arsenal’s recent defeat, or something.

The later start to Lent this year means that “snow” doesn’t appear on the list–last year, it was #48. Myspace hangs on at #99, dropping 48 places.

This list draws from 85,000 tweets from March 7-10, 2011, and excludes retweets.

RankWordCountChange from last year’s rank
1.Twitter42970
2.Facebook40600
3.Chocolate31850
4.Swearing2527+1
5.Alcohol2347-1
6.Sex2093+3
7.Soda1959-1
8.Lent1493-1
9.Meat1352-1
10.Fast food13030
11.Sweets12520
12.Giving up things778+7
13.School768+27
14.Religion745+1
15.Coffee707-3
16.You675+6
17.Social networking665+15
18.Chips664+3
19.Junk food594-1
20.Bread571+6
21.Smoking555-4
22.Candy541-8
23.Charlie Sheen511 
24.Work482+4
25.Stuff467-2
26.Catholicism436-10
27.Food395+3
28.Shopping363+1
29.Marijuana358+31
30.Beer346-10
31.Fried food307-7
32.Homework306+27
33.Cheese297+4
34.Cookies293+11
35.Red meat285-10
36.Masturbation285+8
37.Virginity253+26
38.Pancakes252+20
39.Rice236-5
40.Booze235+2
41.Coke234-3
42.Boys229+24
43.Sugar229-16
44.Sobriety226+10
45.Procrastination226-10
46.Nothing219+21
47.Winning219 
48.Ice cream211-7
49.Caffeine203-16
50.McDonald's195+27
51.Church188+28
52.Wine188-3
53.TV184-7
54.Starbucks183-15
55.Texting182-12
56.Liquor181-1
57.Negativity180+26
58.Carbs179+10
59.Christianity177-12
60.Justin Bieber176+9
61.Pizza175-11
62.French fries159+2
63.Me157+9
64.Losing155 
65.Men152-13
66.Fizzy drinks151 
67.Porn147+4
68.Lint147-11
69.Trophies144 
70.Tumblr144 
71.Desserts142-15
72.Chicken140+15
73.Pork139-3
74.Cake132+8
75.Tea127+19
76.Sarcasm127+14
77.Diet Coke119-16
78.Laziness118-13
79.Sleep117-6
80.Jesus115-4
81.College111 
82.Internet110-46
83.Complaining108-9
84.Breathing103 
85.Takeout98 
86.Beef98-8
87.People96+11
88.New Year's resolutions96+1
89.Him94-5
90.Tiger blood92 
91.Makeup91 
92.Juice90-7
93.Clothes89 
94.My phone88 
95.God87-15
96.Abstinence85-15
97.Stress84 
98.Chipotle82 
99.Myspace81-48
100.Eating out81-25

Image created using Wordle.

Posted in Lent, Twitter

Presentation on Tweeting the Bible

Here’s a presentation I just gave at the BibleTech 2010 conference about how people tweet the Bible:

Also: PowerPoint, PDF.

I distributed the following handout at the presentation, showing the popularity of Bible chapters and verses cited on Twitter. It displays a lot of data: darker chapters are more popular, the number in the middle of each box is the most popular verse in the chapter, and sparklines in each box show the distribution of the popularity in each chapter. (Genesis 1:1 is by far the most popular verse in Genesis 1, while Genesis 3:15 is only a little more popular than other verses in the chapter.)

The grid shows the popularity of chapters and verses in the Bible as cited on Twitter.

Posted in Bible, Twitter, Visualizations